Will stocks keep looking through potential challenges ahead?
ANTHONY SAGLIMBENE – CHIEF MARKET STRATEGIST, AMERIPRISE FINANCIAL
WEEKLY MARKET PERSPECTIVES — July 21, 2025

Stocks edged higher last week, with the NASDAQ Composite leading major U.S. stock averages. Incoming economic and corporate profit data showed continued resiliency across key fundamentals, while stocks largely ignored White House rhetoric on trade and Federal Reserve policy.
This week, a ramp higher in second quarter corporate earnings reports will keep investors and markets busy. In addition, preliminary looks at July manufacturing and services activity could also shed some light on how the U.S. economy is performing at the start of Q3.
Last week in review:
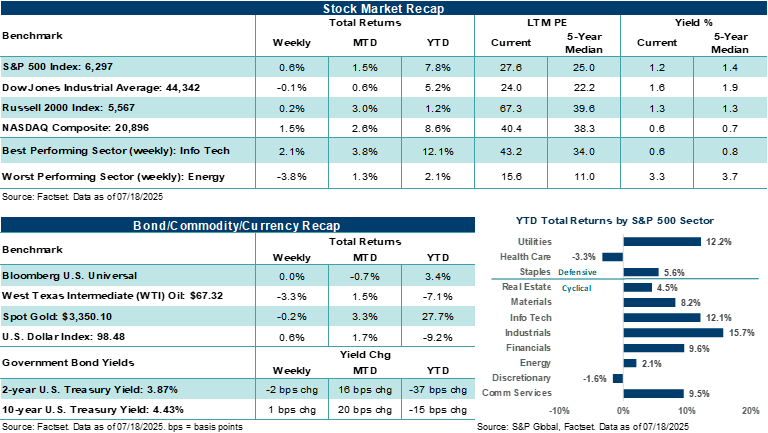
- The S&P 500 Index (+0.6%) and NASDAQ Composite (+1.5%) hit fresh new highs.
- The Dow Jones Industrials Average and Russell 2000 Index ended the week largely flat.
- U.S. Treasury's finished mixed across the curve, with the 30-year yield ending the week around 5.0%.
- The U.S. Dollar Index finished higher, Gold edged lower, and WTI crude broke a two-week winning streak.
- The June headline Consumer Price Index (CPI) rose by +2.7% year-over-year, while the core rate rose by +2.9%.
“August and September are typically the worst two months for stocks, with September averaging a 2.0% decline over the past decade. That said, we believe weaker seasonality isn't a reason to be negative on the market right now. We believe stable fundamentals support current stock prices, and potential volatility in the coming months should be looked through if conditions remain firm.”
Anthony Saglimbene - Chief Market Strategist, Ameriprise Financial
- June retail sales rose +0.6% month-over-month, easily surpassing expectations for a +0.1% gain.
- Weekly initial jobless claims fell for the fifth straight week.
- U.S. banks kicked off the second quarter earnings season, and in most cases, surpassed analyst estimates.
- President Trump continued to push tariff rhetoric (e.g., a possible 15% to 20% minimum rate on the European Union) and floated the idea of firing Fed Chair Powell before softening his tone.
- With stocks now at all-time highs, investor sentiment continues to improve, S&P 500 valuations are currently very stretched (e.g., the Index's price-to-earnings ratio is in the 98th percentile), and the most heavily shorted stocks have nearly doubled since their April lows.
Will solid fundamentals allow investors to look through potential challenges ahead?
As noted above, the S&P 500 and the NASDAQ Composite hit fresh all-time highs last week. In our view, investors smartly looked through President Trump's tariff bluster earlier in the week (e.g., 30% reciprocal tariff rates for Mexico and the European Union) and his not-so-subtle threats to fire Fed Chair Powell. We believe the market is currently discounting these headlines for two primary reasons:
- President Trump's outsized tariff threats are a part of what appears to be an ongoing strategy to pressure countries into trade deals ahead of the August 1 reciprocal tariff deadline.
- The hurdle rate to remove Powell from the Federal Reserve's Chair position is extremely high and would require clear malfeasance, which the recent controversy stirred up on Fed building renovations does not meet, in our view.
Instead, investors are keeping their focus on incoming economic and earnings data, which last week, continued to show a resilient fundamental backdrop. That's not to say the two political dynamics above can't introduce volatility if acted upon, but for now, investors appear comfortable looking through the Washington noise.
Notably, June's inflation data was largely benign from a headline perspective. However, core consumer inflation (ex-food and energy) rose more than expected. And goods inflation (which is more exposed to tariffs) continues to show consistent upward pressure — a potential problem for the market and the Fed should the upward pressure continue into the fall. The Fed's latest Beige Book echoed this dynamic, with participants citing persistent inflation pressures, especially around tariffs. That said, labor conditions remained stable in the report, with some notable caution around hiring. Importantly, retail sales in June rose more than expected and helped reverse some of May's steep decline. Gains were broad-based across autos, clothing, home improvement, and restaurants, with consumers supported by a strong labor market and low unemployment. In our view, the latest retail sales report reflects a cautiously optimistic consumer who remains willing to spend. Finally, a preliminary look at July University of Michigan consumer sentiment hit its highest level in five months, with one-year ahead inflation expectations falling for a second straight month. Bottom line: Consumers remain resilient, and some recent improvement across sentiment and spending helps support recent equity gains, in our view.
On the earnings front, JPMorgan Chase, Citigroup, and Wells Fargo, for example, all beat Q2 profit estimates. JPMorgan and Citi even guided net interest income higher. Trading desks at the large banks benefited from Q2 volatility and could continue to do so if volatility returns in the second half. Importantly, lending fundamentals in the U.S. remain strong, and a potential pickup in merger and acquisition and IPO activity could support investment banking in the second half. In our view, key bank reports and outlooks last week kicked off the second quarter earnings season on a positive note, demonstrating the capital plumbing of the U.S. economy is in solid shape.
Meanwhile, Taiwan Semiconductor (i.e., the world's largest chip maker) reported record second quarter profits and raised its full-year guidance, projecting artificial intelligence semiconductor revenue to double in 2025 and grow at a mid-40% annual rate over the next five years. Additionally, NVIDIA and others received White House approval to resume selling certain AI chips to China, reversing prior restrictions. We believe this policy reversal signals a continued willingness by the Trump administration to adjust when it benefits negotiations (i.e., with China) or helps ease corporate and economic pressure here in the U.S.
Yet, despite the S&P 500 hitting a new high last week, trading activity thus far in July suggests the Index is in the process of consolidating its outsized gains made over recent months. In our view, this consolidation is healthy and could allow the major average to digest Q2's aggressive rally and establish new support and resistance levels for technical traders. While the current macroeconomic backdrop remains solid (excluding tariff risks), investors are heading into a historically weaker seasonal period.
For example, August and September are typically the worst two months for stocks, with September averaging a 2.0% decline over the past decade. That said, we believe weaker seasonality isn't a reason to be negative on the market right now. We believe stable fundamentals support current stock prices, and potential volatility in the coming months should be looked through if conditions remain firm. And when it comes to seasonal trends for the market, it's important to keep in mind that the worst two-month period for stock returns (August-September) is followed by the best three-month stretch of the year (October-December).
Yes, stock volatility is currently low, investor complacency is probably a little high, and equity valuations leave little room for error. Yet, as long as investors understand the market context, the ebbs and flows in seasonal patterns, and whether or not any potential weakness reflects a change in fundamentals, we believe investors should be able to navigate the environment with confidence. And importantly, have a plan if volatility does arise over the coming weeks and months. We believe dollar-cost averaging, rebalancing strategies, and having a short-list of high-quality investments one would purchase if placed on sale can be a prudent response to potential market pressure.
The week ahead:
-
With 12% of S&P 500 second quarter profit reports complete, blended earnings per share (EPS) are higher by +5.6% year-over-year on revenue growth of +4.4%. 83% of S&P 500 companies have reported positive EPS surprises, which is better than the five-year average of 78%, per FactSet. This week, roughly 22% of the S&P 500 will report results, including five Dow 30 components. A range of companies are on the docket, including Verizon Communications, Alphabet, Coca-Cola, Lockheed Martin, General Motors, Tesla, and Chipotle Mexican Grill.
-
June new and existing home sales, as well as preliminary July S&P Global PMI data, line the week.