 Return to My Accounts
Will persistently high interest rates dampen stock momentum?
Anthony Saglimbene, Chief Market Strategist – Ameriprise Financial
June, 17, 2024


Generally, when interest rates are high, stocks can experience bouts of increased volatility.
But that hasn’t necessarily been the case in the past year.
Thanks to Big Tech’s standout performance, stocks have been resiliently positive — despite the Federal Reserve leaving its policy rate at the highest levels seen over the last two decades. But will the lack of movement on interest rate cuts ultimately detract from this momentum?
Here’s what investors should consider when looking at interest rates and their influence on stock prices moving forward:
Inflation forecasts
That said, we see inflation falling closer to the Fed’s 2.0% target in the back half of the year, particularly across services inflation. This should allow the Federal Reserve more room to take its first step in easing policy rates. The Bank of Canada and the European Central Bank each lowered their policy rates this month to help support economic growth, citing increased confidence in their inflation forecasts. If the Fed follows a similar path later this year (data dependent, of course), broader stock averages could see increased tailwinds.
Job market data
However, if inflation remains stubborn at current levels, continued strength in employment (e.g., U.S. nonfarm payrolls have grown by over +200,000 jobs per month this year on average) may push out expectations for a September Fed rate cut. Notably, a strong job market could keep wage pressures firm, resulting in less confidence among policymakers that inflation is moving sustainably lower. As a result, this could prevent government bond yields from falling more meaningfully later this year, which may challenge some upward momentum across stocks and likely outside of other dynamics influencing mega-cap technology.
Historical asset performance
Historically, most major asset classes perform well in an environment where the Fed has completed its rate hikes and the economy is still growing (i.e., no recession in the subsequent 12 months). As we approach the first anniversary of the last Fed rate hike for this cycle (July 2023), the S&P 500 is higher by roughly +20% on a total return basis since the last Fed hike, the Bloomberg U.S. Aggregate Bond Index is higher by +3.2% and the Bloomberg Commodity Index is lower by 4.7%. Moving forward, as long as the U.S. economy is growing, a recession is avoided (we forecast the U.S. economy to advance by +2.2% in 2024) and the Fed is done raising interest rates, we believe stocks have the potential to grind higher.
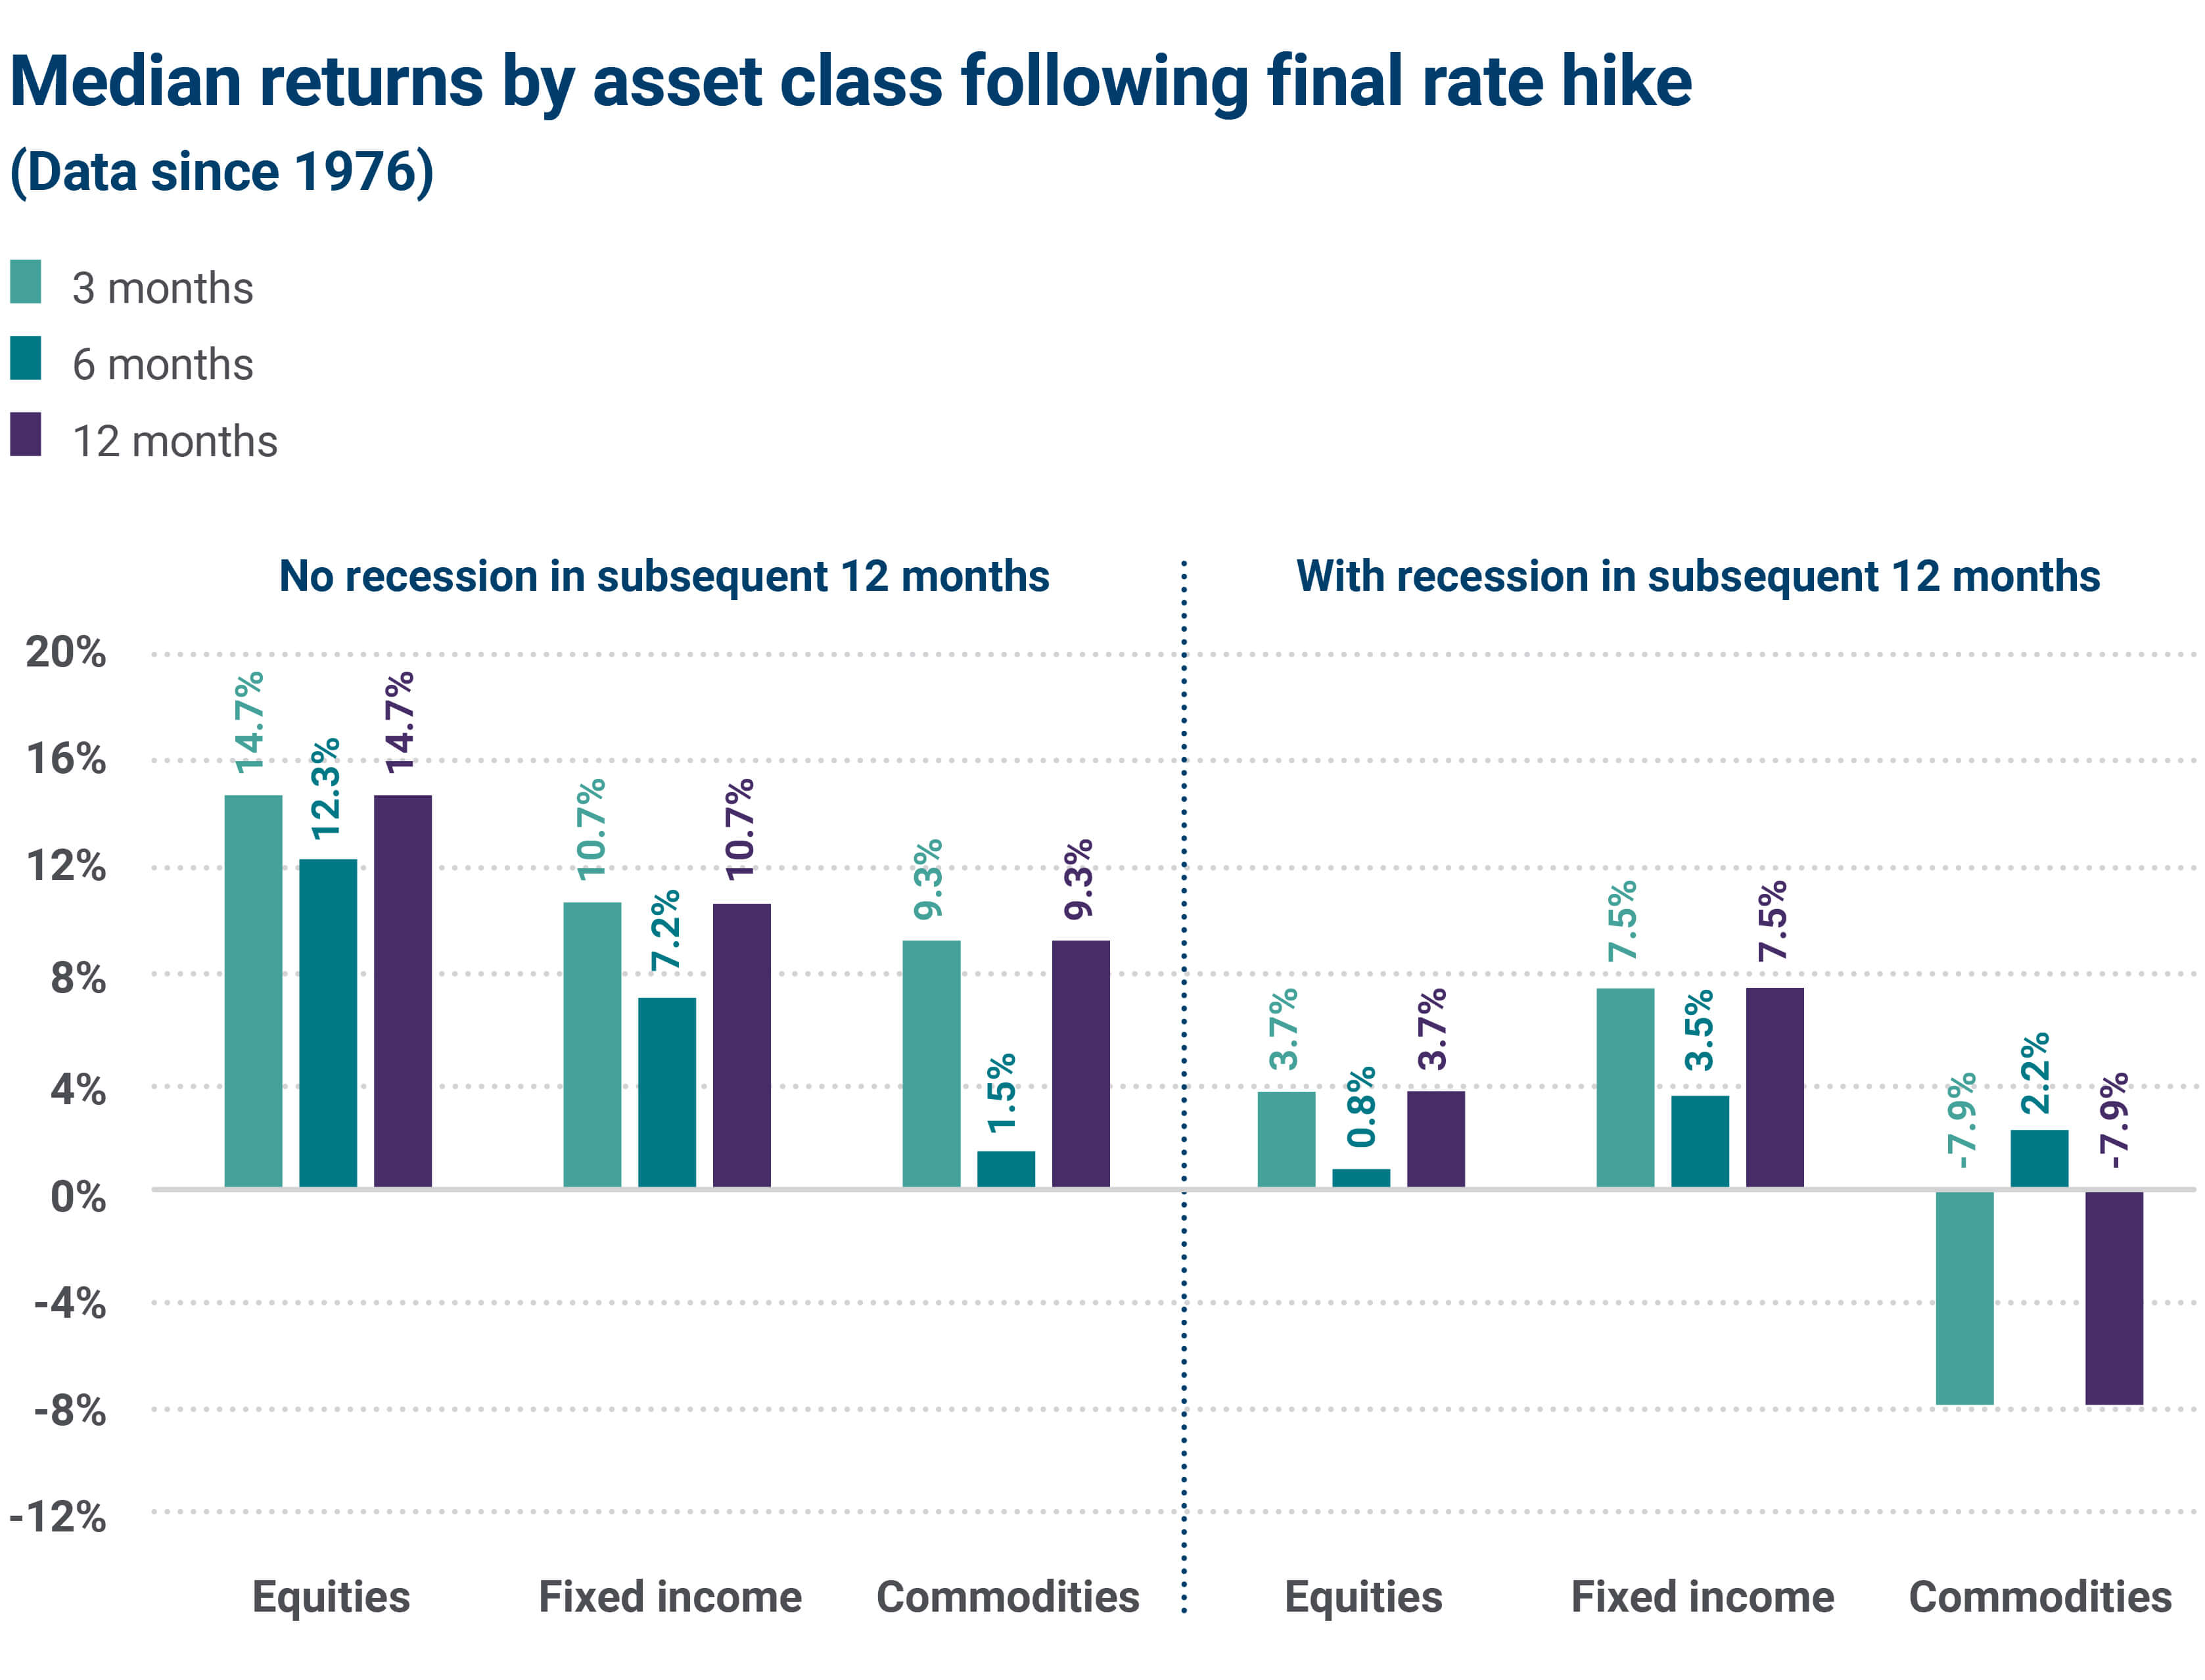
Source: Bloomberg, S&P Dow Jones Indices, National Bureau of Economic Research (NBER), American Enterprise Investment Services, Inc. Equities are represented by the S&P 500 Total Return Index, Fixed Income is represented by the Bloomberg U.S. Aggregate Bond Total Return Index, Commodities is represented by the Bloomberg Commodity Total Return Index. Recessions are defined by the NBER. Rate hiking cycles are defined by two or more positive increases without a decrease in the Fed Funds target rate. Data is since Jan. 1, 1976, which is the date the Bloomberg U.S. Aggregate Bond Index started. Past performance is not a guarantee of future results. Investors cannot invest directly in an Index. Data as of May 31, 2024.
Bond yield volatility
Recent volatility across government bond yields has also played a role in shaping how stock prices trade week-to-week. In our view, the volatility in bond yields is primarily due to the incoming inflation and economic data that informs the Fed’s decision to cut rates this year. Here’s what this means — at a high-level:
- Inflation/econ data that comes in too hot and dials back Fed rate cut expectations helps push government bond yields higher and could create a headwind for stock prices over the near term.
- Conversely, inflation/econ data that comes in weaker-than-expected but shows continued signs of firmness (helping support Fed rate cuts) could help push government bond yields lower and may place a tailwind behind stock prices.
Warmer-than-expected economic data, Fed commentary pointing to a higher-for-longer policy stance and still-elevated services inflation have led to bond yields creeping higher on days when the market is less confident the Fed will be able to cut rates this year. And with the S&P 500 Index touching new highs this month and expensive valuations across several pockets of the market, investors become less willing to push stocks higher on days when the data doesn’t quite align with the idea that the Fed will cut rates this year.
However, some continue to see a scenario where government bond yields remain elevated, pointing to a risk of persistent inflation, growing caution about the amount of new Treasury auctions taking place to fund U.S. debt/deficit spending and the Federal Reserve leaving its policy rate unchanged through 2024. These are certainly valid concerns that investors shouldn’t dismiss, in our view.
Bottom line
We believe firm economic conditions, expected strong Q2 S&P 500 profit growth and a low unemployment rate are notable reasons to remain constructive on equities, despite the rate environment. And if rates remain elevated this year and inflation takes longer than expected to move to the Fed’s target, it’s likely because economic and corporate profit growth is holding up better than expected. All else equal, that’s not a bad environment for stocks.
Further, government bond yields should gradually decline in the back half of the year as inflation continues to cool, giving the Fed greater confidence to take their first step toward easing policy rates later this year, possibly after November’s election. Outside of some potential bouts of market volatility, possibly over the summer and early fall, as investors attempt to discount election results, lower rates, a growing economy and strengthening profit trends could keep stock momentum generally positive in the second half.
Get personalized insights
If you’d like perspective on how current market developments may affect your investment portfolio, contact your Ameriprise financial advisor.