Where do markets go from here?
ANTHONY SAGLIMBENE – CHIEF MARKET STRATEGIST, AMERIPRISE FINANCIAL
WEEKLY MARKET PERSPECTIVES — April 7, 2025

Last week was the type of week that most investors may be best served by not logging into their investment accounts to see what happened. U.S. stocks shed $6.6 trillion in the last two days of the trading week as investors harshly rejected President Trump’s tariffs on goods imports from nearly every country in the world. U.S. stocks posted their worst week since March 2020. Fresh looks at U.S. labor trends during the week showed a solid foundation, but investors ignored the signals, as the data is likely stale and too backward-looking to be relevant based on last week’s tariff developments.
This week, key inflation reports and the start of the Q1 earnings season line the calendar, in addition to what is expected to be more heavy news flow from the White House. Bottom line: Investors should prepare for another difficult week if the Trump administration’s narrative on tariffs does not soon begin to recognize the damage being incurred in financial markets.
“History is very clear on market event shocks. When the negativity loop gets rolling to this type of scale, it’s very hard to reverse without a strong fiscal or monetary policy response to help break the fog of decline.”
Anthony Saglimbene - Chief Market Strategist, Ameriprise Financial


For illustrative purposes only. An index is a statistical composite that is not managed. It is not possible to invest directly in an index. Past performance is not a guarantee of future results.
Last week in review:
-
On Wednesday, President Trump announced sweeping reciprocal tariffs, targeting over 180 countries. Over the weekend, a new 10% universal tariff rate was imposed on all U.S. imports from other countries. However, several key U.S. trading partners will face levies that are multiples of that figure beginning on April 9. If this tariff policy is enacted in full for an extended period, we believe the global economy would likely slow materially, and corporate profits would suffer immensely. Such economic disruption is highly difficult to forecast, as is predicting what comes next. Thus, investors took a sell first, ask questions later approach to stocks last week.
-
China quickly retaliated against the U.S. trade aggression (e.g., a 54% all-in tariff rate on Chinese imports to the U.S.) by slapping a 34% tariff rate on U.S. imports to China beginning April 10. The European Union said it wants to negotiate with the U.S. but is prepared to retaliate if necessary. Given USMCA goods were excluded from the latest round of tariffs, reactions from Canada and Mexico were more muted.
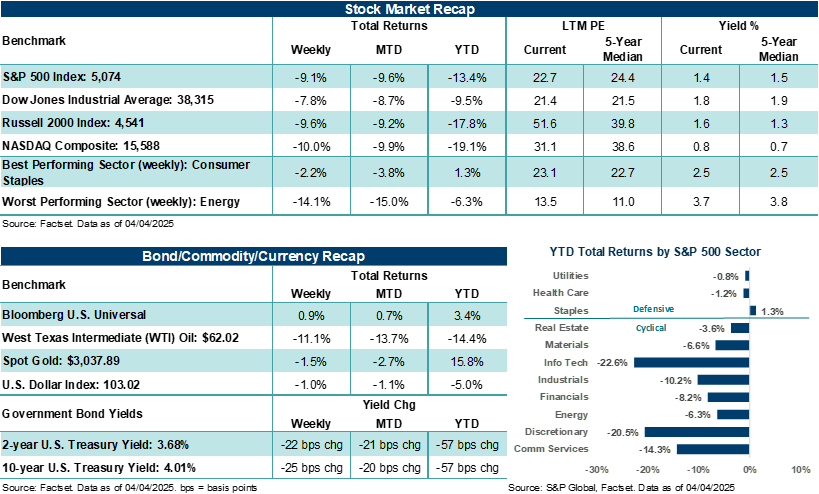
- The S&P 500 Index posted its worst back-to-back sessions on Thursday (-4.8%) and Friday (-6.0%) since March 2020. The broad-based U.S. stock benchmark fell over 9.0% on the week and is now down nearly 17.5% from its February high. Volatility (measured by the CBOE VIX Index) finished at its highest level since April 2020. All eleven S&P 500 sectors finished the week lower, with Consumer Staples (-2.2%) and Utilities (-4.5%) somewhat mitigating the selling pressure.
- The NASDAQ Composite and Russell 2000 Index fell 10.2% and 9.7% on the week, respectively. Both major U.S. stock indexes are in bear markets, off more than 20% from their recent highs. Notably, the Magnificent Seven, collectively, which powered the stock market’s rise over the last two years, are now lower by roughly 28.5% from the high.
- The Dow Jones Industrials Average finished the week lower by 7.9% and is down roughly 15% from its recent high.
- U.S. Treasury prices rallied sharply as yields fell. Investors quickly sought shelter in government bonds, with the two-year yield falling to levels last seen in March 2023 and the ten-year yield dropping below 4.0% for the first time since October.
- Gold finished lower for only the second time in the past fourteen weeks, though the precious metal did set a fresh new high during the week. West Texas Intermediate (WTI) crude posted its largest weekly decline since March 2023 as global demand expectations reset lower. The U.S. Dollar Index also finished lower.
- In other highlights, March nonfarm payrolls grew a solid +228,000, stronger than the +120,000 - 140,000 jobs expected. The unemployment rate ticked higher to 4.2% from 4.1% in February, with average hourly earnings (a measure of wage inflation) coming in as expected. Job openings in February fell to December 2024 levels, Challenger job cuts in March jumped 60% month-over-month (the third highest jump on record), and March ISM manufacturing fell back into contraction. On Friday, Fed Chair Powell, in a speech, noted that tariffs could raise inflation and lead to slower growth. Notably, Powell said progress on bringing inflation back to the 2.0% target has slowed, and as tariffs work through the system, inflation is likely to rise over the coming quarters.
Where do markets head after the worst week in over five years?
We will start by saying that the tariff policy announcements that came out of the White House last week, as well as China’s retaliatory response, if enacted as proposed, are likely going to be far more disruptive to economic and profit growth this year than most expected. Though U.S. carve-outs for U.S. – Mexico – Canada Agreement (USMCA) goods and temporary exemptions for pharmaceuticals and semiconductor imports may be underappreciated by investors at the moment, the risk of a global trade war, and thus much slower global growth in 2025, has become a real threat to our outlook for this year. Last week’s tariff moves will move the average U.S. tariff rate from 2.5% in 2024 to more than 20% if they go into effect — the highest level since the 1930s. At the same time, stock prices have quickly moved lower in anticipation of these negative developments.
For example, two of the four major U.S. stock indexes, the NASDAQ Composite and Russell 2000 Index, have quickly fallen into bear markets. Arguably, each of these indexes has already started to price in recessionary conditions as it pertains to technology and small-cap domestic companies. Typically, when major stock indexes fall more than 20% from their highs, it precedes the onset of a recession. However, that point isn’t very informative to longer-term investors because by the time a recession is clearly visible or officially called, economic and profit conditions are usually on the road to recovery. Importantly, broader measures of the U.S. stock market, including the S&P 500 Index and Dow Jones Industrials Average, have not yet fallen into a bear market, despite each Index being down 15% or more from their recent highs. Unfortunately, it won’t take much more pain this week to push these broad measures of the U.S. stock market into bear markets at the rate stock prices are currently declining.

For illustrative purposes only.
Fortunately, economic fundamentals sit in a position of strength heading into this difficult period, profit estimates for this year continue to point toward growth (though that could quickly change). In our view, the market is in desperate need of some positive news out of the White House, which could drive a modest relief rally, at least temporarily, given such oversold stock conditions. Yet, further trade news this week or tone-deaf responses from the White House could quickly tip broader stock indices into bear markets and do more lasting damage to consumer and business confidence, which would likely erode economic and profit conditions, leading to stalling growth momentum. History is very clear on market event shocks. When the negativity loop gets rolling to this type of scale, it’s very hard to reverse without a strong fiscal or monetary policy response to help break the fog of decline. But in this case, the negativity in the market is because of U.S. fiscal policies (i.e., tariffs), and in our view, monetary support is likely at lower stock levels. In our view, the Federal Reserve has room to cut rates to support labor markets (should they falter). Nevertheless, because of still elevated inflation and uncertainty around tariff impacts, policymakers may be delayed in their response. Bottom line: Investors and the stock market may be on their own for the time being to manage through the volatility if the White House doesn’t soon course correct.
But keep these important points in mind as we all navigate the coming days and weeks, which could be very volatile. When volatility spikes to the levels we saw last week, which is usually accompanied by steep stock price declines, S&P 500 returns over the next one, three, and five years tend to be above average. While last week’s decline is making this point harder to lean on, the S&P 500 usually faces corrections in any given year, and often, it still finishes the year higher, particularly when a recession is avoided.
Finally, staying invested in stocks continuously, even during periods of extreme market stress, materially outperforms strategies that attempt to time the market over longer periods. We don’t know how much of investors’ anxiety about a pretty dire environment for this year is already priced into stock prices — arguably 9% - 10% more than a week ago. However, we do know that at current levels, it likely makes more sense to focus on the following: Know what you own. Maintain a high-quality investment bias. Bonds and cash are doing their job and reducing portfolio stress. And at some point, long-term investors will want to be thinking about buying stocks as opposed to selling. Along with diversification strategies, income-producing assets, large-cap value stocks, international stocks, consumer staples and utilities, and alternative investments could also help mitigate further downside pressure.
Granted, the average S&P 500 bear market decline is roughly 35% going back to 1950, which means there’s plenty of downside for stocks from here if conditions continue to get worse. But a diversified portfolio (including cash, bonds, and alternative investments) should help insulate some of that decline and keep you invested until stocks (at some point) turn the corner. Let’s hope that turn happens before these tariff threats do real damage to the economy and profits.
The week ahead:
While this week’s fresh looks at consumer and producer inflation are largely too backward-looking to inform where the ball is headed, given last week’s developments, we suspect investors will still closely monitor the reports as they could serve as the jumping off point for where inflation trends head from here. The big U.S. banks kick off the first quarter earnings season on Friday, and investors will likely be looking for commentary that sheds additional light on how consumers and businesses are responding to recent volatility.
- The March headline Consumer Price Index (CPI) is expected to decline to +2.6% from +2.8% in February on an annualized basis, while the core rate (ex-food and energy) is expected to tick lower to +3.0% from +3.1%. The core Producer Price Index (PPI) is expected to tick higher to +3.5% in March on an annualized basis from +3.4% in February.
- The latest reads on small business optimism, consumer credit, and a preliminary look at April Michigan consumer sentiment will provide investors with fresh looks at consumer and business trends. In addition, the latest FOMC meeting minutes could provide further insight into policymaker’s views on rate policy. However, this information has also become stale, given market and tariff developments since the March meeting.
- Delta Airlines, JPMorgan Chase, Morgan Stanley, BlackRock, and Wells Fargo all report earnings results this week. Q1’25 S&P 500 earnings per share (EPS) is expected to grow by +7.0% year-over-year on sales growth of +4.2%. During the first quarter, analysts cut Q1 estimates by 4.2%, which is above the five and ten-year averages.