What investors should be watching as the second half starts
ANTHONY SAGLIMBENE – CHIEF MARKET STRATEGIST, AMERIPRISE FINANCIAL
WEEKLY MARKET PERSPECTIVES — July 7, 2025

U.S. major stock averages closed higher in the shortened July 4 holiday week, with the S&P 500 Index and NASDAQ Composite each closing at new all-time highs. Job conditions in June proved stronger than expected, and President Trump signed into law the GOP's One Big Beautiful Bill, extending expiring tax provisions for all and lowering taxes even more for some.
This week, the market's attention will turn to trade headlines and a rather sparse economic calendar.
Last week in review:
-
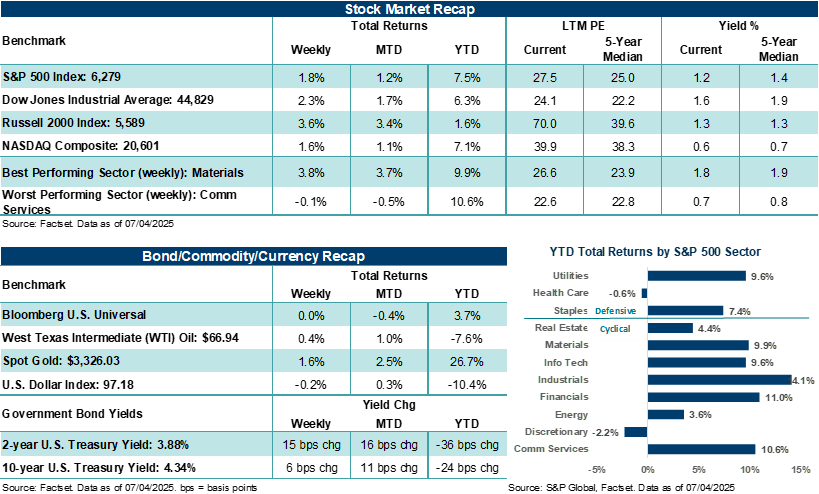
The S&P 500 Index gained +1.8% and the NASDAQ Composite advanced +1.6%. Materials (+3.8%), Information Technology (+2.4%), and Financials (+2.4%) drove major averages higher on the week. The path of least resistance for stocks remained higher throughout the week.
- In addition, the Dow Jones Industrials Average rose +2.3% and the Russell 2000 Index jumped +3.6%. The Russell 2000 Index is now positive on the year, with last week's gains helping narrow the performance gap between large and small-cap stocks.
“With the second half now underway, we believe equity prices at all-time highs have largely discounted a path ahead that incorporates a pretty benign inflation, growth, and trade environment in the U.S., which, in our view, is a risk if the next few months don't go quite as scripted.”
Anthony Saglimbene - Chief Market Strategist, Ameriprise Financial
- U.S. Treasury prices were generally weaker across the curve. Notably, the 2-year yield jumped higher on Friday after June's nonfarm payrolls report suggested a July Federal Reserve rate cut is pretty much a long shot at this point.
- The U.S. Dollar Index weakened slightly, Gold advanced higher, and West Texas Intermediate (WTI) crude oil rebounded after the prior week's loss of 11.3%.
- June nonfarm payrolls rose +147,000, surpassing estimates calling for +118,000 jobs. Notably, April and May jobs were revised higher by a combined +16,000. The unemployment rate fell to 4.1% in June from 4.2% in May. The bulk of job growth last month came from healthcare, social services, and local/state government. In addition, ADP private payrolls for June and May job openings showed mixed results but also reflected a stable labor market. Bottom line: Despite slower job growth, the U.S. employment backdrop remains supportive of a generally constructive view of U.S. macroeconomic conditions heading into the second half.
- ISM manufacturing and services reports showed mixed results, with reads on economic activity coming in a tad light of expectations. Interestingly, respondent commentaries continued to lean cautious against current tariff uncertainties and an uneven demand environment.
- Congress passed President Trump's One Big Beautiful Bill. The bill makes expiring tax provisions from the 2017 Tax Cuts and Jobs Act permanent, temporarily lowers taxes on tips, overtime wages, and Social Security, and increases spending on defense and border security. The Congressional Budget Office estimates the new law will add $3.4 trillion to the U.S. deficit over ten years.
- The U.S. and Vietnam reached a trade agreement that places a 20% base tariff on Vietnam imports and a 40% tariff on products coming from Vietnam that are considered "transshipments" to limit the country being used by China as a conduit for its exports.
What investors should be watching at the start of the second half.
As noted last week, equity markets proved remarkably adaptable and resilient in the face of geopolitical shocks and trade uncertainty in the first half, largely because economic and profit conditions stood on firm footing throughout.
With the second half now underway, we believe equity prices at all-time highs have largely discounted a path ahead that incorporates a pretty benign inflation, growth, and trade environment in the U.S., which, in our view, is a risk if the next few months don't go quite as scripted.
Most investors would agree that the path forward remains clouded by unresolved trade issues, elevated inflation, and a still high degree of uncertainty around overall impacts on the macroeconomic environment. For now, investors appear comfortable reserving judgment on a variety of unknowns, waiting to see whether the second half of the year will bring clarity or further complexity. Thus, maintaining a disciplined and well-constructed investment approach that doesn't lean too bullish or too bearish is a solid way to start the second half, in our view.
That said, the path forward for the broader market in the second half will likely come down to how economic and profit conditions perform against expectations in the third and fourth quarters. In our view, major stock averages currently reflect an environment where ongoing trade developments do not materially alter economic stability in the second half or materially place upward pressures on inflation. Although a modest slowdown in consumer and business activity over the coming months, combined with a potential modest uptick in goods inflation (due to tariffs), is unlikely to knock stocks off their current trend, more meaningful shifts that negatively impact investor outlooks for growth could create headwinds for stocks at current levels.
Additionally, given that impacts from tariffs have been limited on the economy and corporate profits thus far (but are widely expected to be more visible in the second half), we believe investors' more sanguine assumptions about the investing landscape leave stocks susceptible to periods of elevated volatility.
Importantly, corporate profitability in the second half, namely across Technology, is expected to remain strong. As was the case in the first half, Technology and Tech-related businesses associated with the artificial intelligence theme are projected to be large drivers of earnings growth in the third and fourth quarters. In our view, this will be a key ingredient in helping justify elevated stock valuations across the broader S&P 500, where the near-term buying opportunity in AI-related stocks created in early April has closed significantly.
Later this month, investors will start receiving fresh updates on second quarter profits and outlooks for the second half. In terms of results, tariff impacts on Q2 earnings are likely to be modest, given companies' ability to front-load inventory and navigate supply chains ahead of April's reciprocal tariffs. That said, FactSet estimates are calling for Q2'25 S&P 500 earnings per share (EPS) to grow by roughly +5.0% year-over-year on revenue growth of +4.2%. Under the surface though, Communication Services and Information Technology are again expected to do much of the heavy lifting in powering Q2 profits, as five S&P 500 sectors are expected to post year-over-year EPS declines (not great) and three additional sectors are expected to post earnings growth below the broader index (also not great).
A less obvious driver of stock prices in the second half will also include the outlook for next year where corporate profits are expected to grow by double digits. While the risk of a recession this year and next year may be low, especially compared to fears in April, we expect profit estimates for next year to start coming in as we get closer to year-end.
Bottom line: We believe the U.S. stock market now reflects a high degree of optimism about the rest of the year, similar to where stocks entered the year. As one might infer from our commentary above, there's now an elevated risk of disappointment, especially after seeing how quickly the overall investment narrative can change based on the constant barrage of White House announcements. Nevertheless, if the script goes as planned and economic activity remains firm, corporate profitability remains solid (especially across Tech), and the inevitable unexpected speed bumps in the road don't throw the market off track too much, stocks have an opportunity to grind higher through year-end.
The week ahead:
On Sunday, U.S. Treasury Secretary Scott Bessent said reciprocal tariffs will revert to April 2 levels on August 1 if countries around the world don't reach a trade agreement with the U.S. Currently, there is a 10% baseline reciprocal tariff rate in place for all countries, outside of special individual country agreements and/or product categories. Based on the individual country or region, and whether deals and outlines of agreements can be struck over the next three weeks, tariff rates could adjust higher between 20% and 49%. As a result of Bessent's announcement on Sunday, stocks could see less volatility this week than they otherwise might have if the 10% reciprocal tariff rate had been allowed to expire on Wednesday without a temporary extension.
- A fresh look at small business optimism on Tuesday, the latest Fed minutes on Wednesday, and weekly jobless data will be the economic highlights of the week.
- In addition to monitoring near-term trading dynamics around U.S. stock averages at all-time highs, investors will also be watching how this week's $119 billion Treasury auction goes. Although the total issuance is unchanged from June levels, now that the debt limit has been raised, shorter-term maturities could see more issuance to help rebuild the U.S. Treasury's cash balance.
These figures are shown for illustrative purposes only and are not guaranteed. They do not reflect taxes or investment/product fees or expenses, which would reduce the figures shown here. An index is a statistical composite that is not managed. It is not possible to invest directly in an index. Past performance is not a guarantee of future results.
Sources: FactSet and Bloomberg. FactSet and Bloomberg are independent investment research companies that compile and provide financial data and analytics to firms and investment professionals such as Ameriprise Financial and its analysts. They are not affiliated with Ameriprise Financial, Inc.
The views expressed are as of the date given, may change as market or other conditions change, and may differ from views expressed by other Ameriprise Financial associates or affiliates. Actual investments or investment decisions made by Ameriprise Financial and its affiliates, whether for its own account or on behalf of clients, will not necessarily reflect the views expressed. This information is not intended to provide investment advice and does not account for individual investor circumstances.
Some of the opinions, conclusions and forward-looking statements are based on an analysis of information compiled from third-party sources. This information has been obtained from sources believed to be reliable, but accuracy and completeness cannot be guaranteed by Ameriprise Financial. It is given for informational purposes only and is not a solicitation to buy or sell the securities mentioned. The information is not intended to be used as the sole basis for investment decisions, nor should it be construed as advice designed to meet the specific needs of an individual investor.
There are risks associated with fixed-income investments, including credit (issuer default) risk, interest rate risk, and prepayment and extension risk. In general, bond prices rise when interest rates fall and vice versa. This effect is usually more pronounced for longer term securities.
Stock investments involve risk, including loss of principal. High-quality stocks may be appropriate for some investment strategies. Ensure that your investment objectives, time horizon and risk tolerance are aligned with investing in stocks, as they can lose value.
Past performance is not a guarantee of future results.
An index is a statistical composite that is not managed. It is not possible to invest directly in an index.
Definitions of individual indices and sectors mentioned in this article are available on our website at ameriprise.com/legal/disclosures in the Additional Ameriprise research disclosures section.
The S&P 500 Index is a basket of 500 stocks that are considered to be widely held. The S&P 500 index is weighted by market value (shares outstanding times share price), and its performance is thought to be representative of the stock market as a whole. The S&P 500 index was created in 1957 although it has been extrapolated backwards to several decades earlier for performance comparison purposes. This index provides a broad snapshot of the overall US equity market. Over 70% of all US equity value is tracked by the S&P 500. Inclusion in the index is determined by Standard & Poor’s and is based upon their market size, liquidity, and sector.
The NASDAQ Composite index measures all NASDAQ domestic and international based common type stocks listed on the Nasdaq Stock Market.
The Dow Jones Industrial Average (DJIA) is an index containing stocks of 30 Large-Cap corporations in the United States. The index is owned and maintained by Dow Jones & Company.
The Russell 2000 Index measures the performance of the small-cap segment of the US equity universe. The Russell 2000 is constructed to provide a comprehensive and unbiased small-cap barometer and is completely reconstituted annually to ensure larger stocks do not distort the performance and characteristics of the true small-cap opportunity set. The Russell 2000 includes the largest 2000 securities in the Russell 3000.
The US Dollar Index (USDX) indicates the general international value of the USD. The USDX does this by averaging the exchange rates between the USD and major world currencies. This is computed by using rates supplied by approximately 500 banks.
West Texas Intermediate (WTI) is a grade of crude oil commonly used as a benchmark for oil prices. WTI is a light grade with low density and sulfur content.
The Institute for Supply Management (ISM) manufacturing index is a national manufacturing index based on a survey of purchasing executives at roughly 300 industrial companies. It is an index of the prevailing direction of economic trends in the manufacturing and service sectors.
The ISM Services PMI is compiled and issued by the Institute of Supply Management (ISM) based on survey data. The ISM services report contains the economic activity of more than 15 industries, measuring employment, prices, and inventory levels; above 50 indicating growth, while below 50 indicating contraction.
Third party companies mentioned are not affiliated with Ameriprise Financial, Inc.
Investment products are not insured by the FDIC, NCUA or any federal agency, are not deposits or obligations of, or guaranteed by any financial institution, and involve investment risks including possible loss of principal and fluctuation in value.
Securities offered by Ameriprise Financial Services, LLC. Member FINRA and SIPC.
© 2025 Ameriprise Financial, Inc. All rights reserved.