Take weaker September seasonality with a grain of salt
ANTHONY SAGLIMBENE – CHIEF MARKET STRATEGIST, AMERIPRISE FINANCIAL
WEEKLY MARKET PERSPECTIVES — September 2, 2025

The S&P 500 Index closed lower last week, but finished its fourth consecutive month higher, making multiple new highs in August.
This week's economic calendar is heavy with releases on employment and updates on manufacturing and services activity that should help inform the odds of a September Federal Reserve rate cut later this month, which already stands at nearly 90%.
Last week in review:
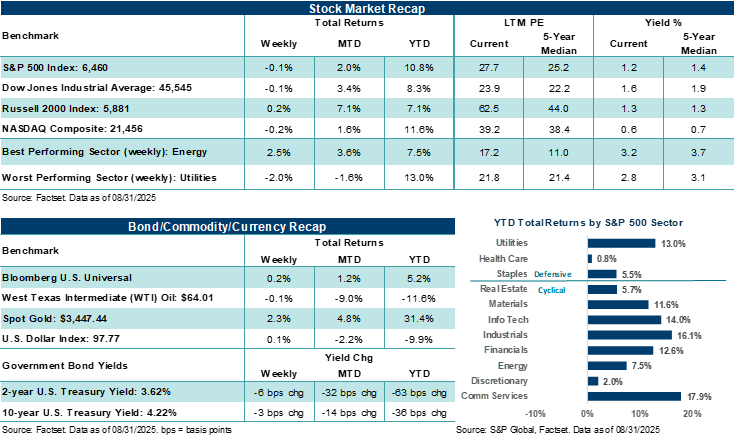
- The S&P 500 closed last week lower by 0.1% but finished August higher by +2.0%. Similarly, the NASDAQ Composite dropped 0.2% on the week but rose +1.6% last month. The Dow Jones Industrials Average and Russell 2000 Index also moved fractionally last week, though the Russell jumped +7.1% in August on prospects for lower interest rates.
- In August, U.S. Treasury prices were mostly firmer across the curve, the U.S. Dollar Index weakened by over 2.0%, Gold gained almost +5.0%, and West Texas Intermediate crude settled lower by 9.0%.
- July headline and core PCE inflation as well as personal spending data came in generally in line with expectations, though personal income softened a bit. Q2 GDP was revised higher to +3.3% from +3.0%. A final look at August University of Michigan consumer sentiment saw year-ahead inflation expectations rise to +4.8% from +4.5% in the first estimate.
- The U.S. Court of Appeals for the Federal Circuit upheld a lower-court decision that ruled that the law President Trump used to invoke his most expansive tariff policies, including reciprocal tariffs, was unlawful. However, these tariffs will remain in place until October 14, allowing the Trump administration time to ask the Supreme Court to reverse the decision of the two lower courts. Notably, the Trump administration is already looking to expand sectoral tariff investigations, which may better insulate its tariff policies from legal challenges moving forward.
“Outside of a September surprise, investors face ongoing threats from trade and tariff unknowns as well as potential economic releases that might show weaker-than-expected trends that could ultimately challenge elevated stock valuations. That said, investors have been navigating those dynamics for months, and stocks have continued to grind higher.”
Anthony Saglimbene - Chief Market Strategist, Ameriprise Financial
A quick take on NVIDIA's earnings last week and its broader impact on Tech and the overall market.
NVIDIA's latest earnings report, while lacking in the eye-popping beats of quarters past, served as a further reminder of the company's far-reaching scale and competitive advantage as the Artificial Intelligence (AI) Revolution gains steam. In our view, its results over the previous quarter reflected ongoing strong demand for AI infrastructure across hyperscalers. In fact, NVIDIA's semiconductors (and increasingly its suite of full-stack capabilities) continue to play a central role in facilitating the buildout of next-generation computing. Bottom line: NVIDIA's overall profit report and outlook last week reinforces the broader secular trend in AI, one that is increasingly shaping the future of enterprise technology, cloud computing, and digital transformation. Given NVIDIA's influence across major U.S. stock averages, this trend should be an overall market positive.
In addition, the company's guidance and commentary help reflect that AI infrastructure spending is undergoing a structural shift. CEO Jensen Huang's projection of $3 to $4 trillion in AI-related investment by the end of the decade highlights the scale of opportunity ahead. We believe NVIDIA's leadership in delivering the hardware backbone for this transformation, particularly through its advanced chips like Blackwell and integrated technologies, positions the company as a key enabler of this trend. Despite some softness in data center and compute revenue in the previous quarter versus expectations (largely driven by an absence of China revenue, which may prove temporary), the overall revenue trajectory in these key areas remains upward sloping, in our view. Over the coming quarters, the company's revenue should be supported by strong hyperscaler demand and emerging use cases across a variety of enterprises, sovereign AI initiatives and possibly robotics.
Notably, China adds complexity and optionality to NVIDIA's outlook moving forward. NVIDIA did not book revenue from China last quarter, and the outlook remains uncertain due to export restrictions and potential U.S. policy changes. However, any revenue from China moving forward is now viewed by investors as upside rather than baseline, which could allow the company to outperform expectations if conditions improve on the China front in the quarters ahead. In our view, this "bonus" potential, combined with already solid demand metrics and expanding global interest in AI, could help support current multiples. That said, NVIDIA's results also reflect some risk and revenue concentration across just a handful of Big Tech companies. Thus, while revenue growth remains outsized, it is increasingly tied to the spending decisions of a few major players like Microsoft and Amazon. This concentration of revenue introduces risk, especially if investor sentiment around AI return on investment begins to shift for the companies doing all the capex spending in AI, which is largely NVIDIA's source of revenue. Yet, the company's continued investment in innovation, its massive share repurchase authorization, and its entrenched role in AI infrastructure suggest it is well-prepared to navigate these dynamics. Bottom line: The secular AI growth story remains intact, and while expectations and Big Tech stock prices and valuations may go through periods of recalibration in the future, the long-term thesis of an AI-driven boom helping drive broader markets and Tech higher over time appears intact.
Take weaker September seasonality with a grain of salt.
The calendar has turned to September, and history suggests markets tend to become more volatile. Investors now face the market's weakest few weeks from a historical perspective. Notably, September is the only month of the year in which the S&P 500 Index has posted a negative average return over the last twenty years. In fact, according to Dow Jones Market Data, the S&P 500 has averaged a September decline of 1.2% and finished higher just 44.3% of the time going back to 1928. If you're keeping tabs, recent examples of September stress include:
-
In 2023, the S&P 500 fell 4.9% in September as U.S. Treasury yields moved to multi-year highs against a backdrop of the Federal Reserve signaling a "higher for longer" message around rates amid still elevated inflation. Tech stocks faced valuation concerns, oil prices were on the rise, and a potential U.S. government shutdown was in the headlines.
- In 2022, the S&P 500 shed 9.3%, one of its worst September performances since 2008. The Federal Reserve raised its policy rate by 75 basis points to combat record-high inflation and signaled more rate hikes ahead. The UK's fiscal turmoil unsettled global investors, and geopolitical risks from the Ukraine war amplified volatility.
- In 2021, the S&P 500 lost 4.8% in September, as a debt ceiling standoff in Washington, China's Evergrande debt crisis, and a new Delta COVID-19 variant weighed on investors' growth outlook.
- In 2020, the S&P 500 declined 3.9% in September after a strong summer rally across Information Technology corrected sharply. Rising cases of COVID-19 and uncertainty about vaccine timelines weighed on sentiment. U.S. election volatility was also a notable headwind for stock prices.
- In 2015, the S&P 500 dropped 2.6% amid Beijing's surprise yuan devaluation in August. That and slowing growth sparked global stock volatility, causing commodity prices to slump as recession worries rose.
Yet, in each of these more recent periods of September volatility, the negativity ultimately subsided, and the S&P 500 went on to post mostly positive performance in the fourth quarter. Bottom line: Outside of a September surprise, investors face ongoing threats from trade and tariff unknowns as well as potential economic releases that might show weaker-than-expected trends that could ultimately challenge elevated stock valuations. That said, investors have been navigating those dynamics for months, and stocks have continued to grind higher. In our view, investors should maintain a diversified portfolio, remain cautiously optimistic about the investment landscape, based on a solid foundation of growth, and look through potential September volatility, should it develop.
The week ahead:
-
Markets kick off Wall Street's most hated month, facing ongoing tariff uncertainties, elevated stock valuations, and key reports on employment and inflation over the coming days and weeks that could inform rate policy over the next few months.
-
August ISM Manufacturing (Tuesday), July Job Openings and Labor Turnover Survey (Wednesday), August ISM Services (Thursday), and the August ADP Employment Survey (Thursday) will add important color to current economic conditions and provide updated perspectives on trade, tariff, and labor conditions.
- Friday's all-important August nonfarm payrolls report is expected to show the U.S. economy added +80,000 new jobs, modestly above July's gain of +73,000, but below this year's average of +85,000. The unemployment rate is expected to hold steady at 4.2%. Outside of much hotter-than-expected job gains last month, we expect the employment report to help support a 25-basis-point rate cut by the Federal Reserve later this month.