A remarkable finish to a remarkably volatile quarter
ANTHONY SAGLIMBENE – CHIEF MARKET STRATEGIST, AMERIPRISE FINANCIAL
WEEKLY MARKET PERSPECTIVES — June 30, 2025

The S&P 500 Index closed last week at a new all-time high, surpassing its previous February peak. The Index broke a two-week streak of declines, while the NASDAQ Composite also hit a fresh new all-time high, ending higher for the second consecutive week and up in four of the last five weeks.
The shortened July 4 holiday week will bring an end to the second quarter on Monday, fresh looks at manufacturing and services activity on Tuesday and Thursday, and key updates on employment throughout the week, including the June nonfarm payrolls report on Thursday.
Last week in review:
-
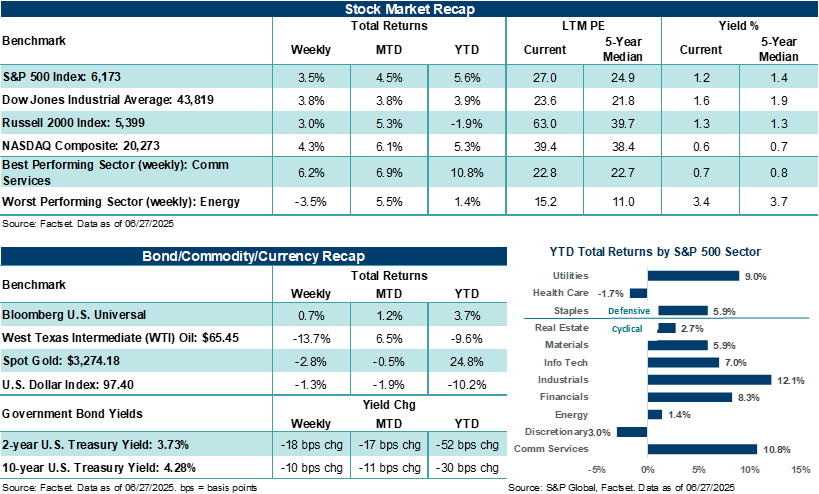
The S&P 500 Index and NASDAQ Composite took out their previous high-water marks, rising +3.5% and +4.3%, respectively. Since their April lows, the S&P 500 is higher by nearly +28.0%, while the NASDAQ is up over +37.0%.
- The Dow Jones Industrials Average (+3.8%) and Russell 2000 Index (+3.0%) also saw strong gains on the week. The Russell 2000 is the only major U.S. stock index that is still negative year-to-date.
- U.S. Treasury prices rallied as yields fell. The U.S. Dollar Index touched its lowest point since March 2022, Gold ended down, and West Texas Intermediate (WTI) crude saw its worst week since March 2023, with reports noting OPEC+ was considering hiking production in August.
“The second quarter of 2025 marked a quarter of extremes, defined by aggressive stock volatility, market resilience, and an investment environment that continually adjusted in response to shifting trade dynamics, geopolitical tensions, and evolving economic and profit signals.”
Anthony Saglimbene - Chief Market Strategist, Ameriprise Financial
- Easing Middle East tensions, investors on "new high alert" for the major stock averages, and the U.S. and China signing a framework trade agreement struck in Geneva last month helped boost sentiment.
- June Consumer Confidence missed estimates, with attitudes about the labor market weakening to levels last seen in March 2021. Housing data came in mostly weaker than expected. The Fed's preferred core inflation measure (ex-food and energy) was hotter than forecasted for May. Preliminary looks at U.S. S&P Global manufacturing and services indexes showed mixed results for June. Bottom line: Slowing economic trends as of late have an increasing number of Federal Reserve officials vocalizing the potential for additional rate cuts in the second half.
Stocks hit new highs as Q2 comes to a close – a remarkable finish in a remarkably volatile environment.
The second quarter of 2025 marked a quarter of extremes, defined by aggressive stock volatility, market resilience, and an investment environment that continually adjusted in response to shifting trade dynamics, geopolitical tensions, and evolving economic and profit signals. At quarter end, the tape shows major averages ultimately persevered through a host of challenges, with the S&P 500 Index now sitting at a new all-time high. An incredible feat during an incredibly volatile and uncertain few months.
The quarter began with the U.S. stock market coming under severe selling pressure. In early April, President Trump's sweeping "Liberation Day" reciprocal tariff announcements triggered the worst two-day selloff in U.S. equities since the COVID-19 pandemic. As the second quarter opened, the S&P 500 Index flirted with bear market territory, the NASDAQ Composite fell into a bear market, and stock volatility surged to levels not seen in years. With markets facing a sudden and unexpected spike in trade friction, investors quickly repriced risk assets as sentiment soured.
But just as quickly as stock sentiment fell, major averages began to recover as investors took advantage of rare buying opportunities. A 90-day tariff reprieve and the exclusion of key tech products from the most aggressive levies helped stabilize U.S. markets. As a result, the S&P 500 posted a historic single-day gain of +9.5% on April 9, its third-largest single-day gain on record. That powerful reversal set the tone for a more constructive May and June, as investors recalibrated expectations and stocks clawed back earlier losses. Notably, in May, the U.S. and China temporarily lowered the temperature of their trade embargo and reduced tariffs to allow for more time to negotiate key differences, which was a key item that helped stocks recover throughout the second quarter. By the end of the quarter, both countries codified a framework deal crafted during their Geneva trade talks.
Economic data throughout Q2 painted a solid but nuanced picture, and one where tariff impacts were minimal, but consumer and business trends moderated. A look back at Q1 U.S. GDP showed the economy contracted by 0.5%, largely due to a surge in imports ahead of tariff implementation. While this marked the first quarterly contraction since 2022, we do not believe the overall decline in GDP was indicative of broad economic weakness. In fact, consumer and business trends have remained firm over the last few months, with the Atlanta Federal Reserve GDPNow forecast currently pointing to +2.9% growth in Q2, as import adjustments reverse. Importantly, the U.S. labor market has remained resilient throughout 2025, with nonfarm payrolls continuing to grow in Q2, albeit at a slower pace. The unemployment rate held steady at a very low 4.2% in May, and job openings remained at healthy levels throughout the second quarter. However, revisions to prior months hint at softening momentum ahead.
In the second quarter, inflation trends and the path ahead were a central concern for the market. While headline CPI and PCE readings showed signs of moderation, core inflation measures proved somewhat sticky in April and May. The Federal Reserve held rates steady throughout the quarter, citing elevated inflation and tariff-related uncertainty. As one might expect, market expectations for rate cuts were pushed further out, as policymakers signaled a cautious stance amid evolving trade and fiscal dynamics. On that last point, the Senate is near passing a revised version of the House's One Big Beautiful Bill Act, designed to extend expiring tax provisions and include other spending items that could add roughly $3.3 trillion to the U.S. budget deficit over the next ten years, according to the Congressional Budget Office.
During the second quarter, commodities and currencies reflected the broader uncertainty across markets. Oil prices were volatile, with West Texas Intermediate (WTI) crude set to finish near $65 per barrel. Geopolitical tensions — particularly the U.S. military's involvement in the Israel-Iran conflict — added temporary upward pressure to energy prices. However, fears of a major oil supply disruption fell by the end of Q2 as the flow of oil through the Strait of Hormuz continues without interruption. As a result, oil prices fell. Gold, meanwhile, surged to record highs above $3,400 per ounce during certain periods of Q2, driven by safe-haven demand as well as concerns over longer-term U.S. fiscal sustainability. The U.S. dollar experienced bouts of weakness, as investors questioned the long-term implications of rising deficits, aggressive U.S. trade policy, and concerns over a potential loss in America's standing with the rest of the world.
All that said, corporate earnings across American companies provided a welcome counterbalance to other macroeconomic uncertainties. First-quarter results were broadly stronger than expected, with S&P 500 earnings per share (EPS) growing +13.3% year-over-year, nearly double the forecast at the end of March. Much of the "Magnificent Seven" reaffirmed their profit dominance, buoyed by strong demand for artificial intelligence infrastructure and services. NVIDIA in particular delivered standout results, reinforcing the secular growth narrative around its AI dominance. However, not all sectors fared equally. Retailers like Target, Walmart, and Nike flagged tariff-related cost pressures and offered cautious outlooks, underscoring the uneven impact of trade policy across corporate America.
Interestingly, investor sentiment oscillated throughout the quarter, touching levels of bearishness seldom seen outside of recessions. April's aggressive selling pressure and macro anxiety ultimately gave way to optimism in May and June, as markets digested earnings, inflation, and policy signals. While we believe Big Tech continues to offer secular growth opportunities, broader market valuations appear stretched at quarter end. In addition, earnings expectations for the second half of the year could be vulnerable to downward revisions if tariffs and trade weigh on demand. Thus, maintaining a cautious but balanced view of growth and risks as the second half gets underway is, in our view, a prudent approach for tactical investors. Nevertheless, we believe investors should see additional clarity on key market overhangs in the third quarter as trade, tariff, and economic and profit impacts become more visible in hard data. Bottom line: Markets proved remarkably adaptable and resilient in the face of geopolitical shocks and trade uncertainty in the first half, largely because economic and profit conditions stood on firm footing. As the second half begins, equity prices at all-time highs have already discounted a path ahead that incorporates a pretty benign inflation, growth, and trade environment, which is a risk if the next few months don't go quite as scripted. In our view, the path forward is still clouded by unresolved trade issues, elevated inflation, and the looming expiration of the 90-day tariff reprieve in early July. For now, investors appear comfortable reserving judgment on a variety of unknowns, waiting to see whether the second half of the year will bring clarity or further complexity. Maintaining a disciplined and well-constructed investment approach that doesn't lean too bullish or too bearish is a solid way to head into Q3, in our view.
The week ahead:
Job, jobs, jobs. That'll be investors' focus before U.S. markets close for Friday's July 4 holiday. June nonfarm payrolls are expected to slow to +115,000 from May's +139,000. The unemployment rate is expected to tick higher to 4.3% from 4.2% in May. Possible trade headlines ahead of the July 9 reciprocal tariff deadline could also drive stock prices this week.