 Return to My Accounts
Q1 earnings season begins as conflict in the Middle East escalates
ANTHONY SAGLIMBENE – CHIEF MARKET STRATEGIST, AMERIPRISE FINANCIAL
WEEKLY MARKET PERSPECTIVES — April 15, 2024

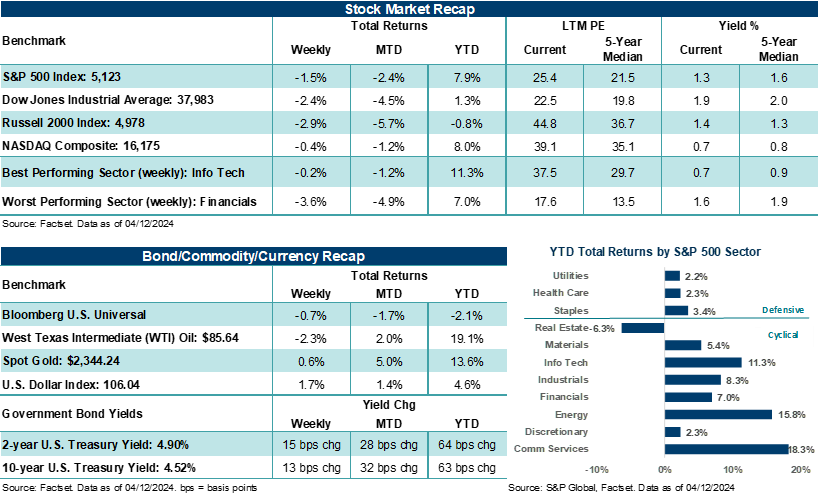
Both the Dow Jones Industrials Average and S&P 500 Index finished lower for the second straight week, while the NASDAQ Composite ended its third consecutive week in the red. The tech-heavy NASDAQ has now finished lower in five of the last six weeks. With investors in a risk-off mood through much of the week and bond yields higher on hotter-than-expected consumer inflation prints for March, there were very few areas of the market that finished the week higher. As a result, all eleven S&P 500 sectors finished lower. However, Information Technology (thanks to Apple’s Mac AI announcement), Communication Services, and Consumer Discretionary outperformed the S&P 500 but still ended the week marginally in the red. Interestingly, these areas took a hit on Wednesday following the release of the March Consumer Price Index and the reset lower in expectations for the number of Federal Reserve rate cuts this year. But by the end of the week, investors had quickly revisited areas that are less sensitive to interest rates and have strong visible and secular growth drivers, which helped Big Tech brush off some of the week’s stock negativity. Bottom line: Stocks have begun to wobble over recent weeks as months of strong price gains and stretched valuations start to catch up with the reality of mixed economic data, still elevated inflation, and evolving expectations for the number of Fed rate cuts this year.
“Stocks have begun to wobble over recent weeks as months of strong price gains and stretched valuations start to catch up with the reality of mixed economic data, still elevated inflation, and evolving expectations for the number of Fed rate cuts this year.”
Anthony Saglimbene - Chief Market Strategist, Ameriprise Financial
Inflation running at higher levels than expected
Given elevated consumer inflation prints in March, bond prices weakened across the curve last week, with the 2-year and 10-year U.S. Treasury yields touching levels last seen in November. Both the U.S. Dollar Index and Gold rose on the week, and West Texas Intermediate (WTI) crude fell roughly 2.0%.
Without a doubt, last week’s market focus centered on inflation updates. The March Consumer Price Index came in hotter than expected on every major measure. On an annualized basis, headline CPI rose +3.5% last month, while core CPI (ex-food and energy) rose +3.8%. Notably, both of these year-over-year measures of CPI were hotter than forecast and at or above February levels. And on an annualized basis, the March Producer Price Index also came in hotter than February levels, both on a headline and core basis. Bottom line: Inflation is currently running at higher levels than many market participants expected just a few months ago. On the consumer side, gasoline prices, shelter costs, apparel, and motor vehicle insurance prices kept inflation elevated last month. “Supercore” inflation, which strips out food, energy, and housing, increased +4.8% year-over-year last month — the highest level in eleven months. This supercore component of inflation is less sensitive to Federal Reserve policies because it includes non-discretionary items such as health and motor insurance as well as property taxes. Importantly, the last mile or so of consumer inflation moving back to the Federal Reserve’s +2.0% target is proving increasingly difficult to attain, at least early in the year.
As a result, market odds for a fed funds rate cut in June moved from roughly 50/50 before the CPI release to just 28% today. By the end of the year, market odds currently suggest two 25 basis point rate cuts by the Fed, seriously resetting expectations for the six to seven quarter-point rate cuts forecast by the market at the start of the year. Simply, market odds for rate cuts this year continue to reset to the reality of the current economic backdrop — which points to stronger-than-anticipated growth and employment trends combined with still-elevated inflation.
Given that stocks have not faced many headwinds this year, higher rates, sticky inflation, and a Fed that could remain sidelined longer than expected could challenge entrenched market assumptions regarding the macroeconomic environment for this year. However, a modest correction in stock prices (if one were to occur), accompanied by a more realistic view of the economy and Fed policy, wouldn’t necessarily be a bad development for investors, in our view. Yet, we believe it’s important to keep in mind that a U.S. economy still growing above its longer-term potential, partnered with an unemployment rate near multi-decade lows, is a pretty good backdrop for stocks and corporate profits. It’s likely part of the reason inflation has been so stubbornly elevated as of late. Yes, most, including the Fed, would like to see inflation ebb back to normalized levels a little faster than the data has shown over recent months. And yes, the market may see some increased volatility if rates remain elevated or the Fed dials back rate cut expectations as a result. This could even prompt some minor adjustments to growth forecasts or what we believe investors may be willing to pay for a stream of earnings for this year. But has last week’s inflation data materially altered our economic and market outlook for this year? The answer is no.
In other items that grabbed investors’ attention last week, the NFIB Small Business Index saw its lowest optimism reading since 2012 amid signs of softening demand. A preliminary look at April Michigan Sentiment showed sideways results for the fourth straight month and year-ahead inflation expectations ticking up to +3.1% from +2.9% last month. Overseas, the European Central Bank (ECB) left rate policy unchanged and kept the door open to a potential rate cut in June. ECB President Christine Lagarde emphasized that ECB policy is not dependent on Fed policy, and a data-dependent approach remains key. In China, March exports fell 7.5% year-over-year following two consecutive months of growth. In addition, imports declined by 1.9% y/y last month. The data somewhat pushes back on the idea that global demand could help lift China’s economy this year and is at odds with improving international demand.
And finally, investors continued their risk-off mood on Friday as geopolitical tensions rose in the Middle East. Expectations of an Iranian attack on Israel over the weekend in retaliation for the recent destruction of an Iranian consulate in Damascus, Syria, which killed several key Iranian commanders, weighed on sentiment. Israel is widely believed to have carried out the attack in Syria. Notably, simmering tensions in the Middle East and a potential escalation of conflict have been key geopolitical risks investors have been unable to entirely dismiss this year.
The week ahead
Markets open the week on edge after Iran indeed attacked Israel over the weekend. Iran and its proxies lobbed over 300 cruise missiles, ballistic missiles, and drones into Israel on Saturday. According to Israel Defense Forces, 99% of the aerial projectiles fired from Iran and others were neutralized before reaching Israel, with the help of the U.S., U.K., and France. The weekend’s missile attacks are the first time Iran has directly targeted Israel from Iranian territory. We believe the provocation has the potential to quickly escalate tensions into a direct military conflict between both countries and/or lead to a broader conflict in the Middle East. Investors will be watching carefully over the coming days if the U.S., its allies, and countries like Saudi Arabia can calm tensions and persuade Iran and Israel to lower the temperature in the region.
Importantly, investors will be watching specifically how Israel responds to the attack. Iran’s actions were well-telegraphed ahead of time and somewhat priced into the market via oil prices and risk-off trading across stock markets last week. However, Israel’s response has not been discounted by the market and could lead to more near-term stock volatility and higher oil prices should its response escalate fighting in the Middle East. Iran is the third largest OPEC oil producer, with the Straits of Hormuz seeing one-fifth of global oil production flow daily.
Here in the U.S., the first quarter earnings season kicks into gear this week with a focus on Financials. Roughly 50% of the companies reporting earnings over the next two weeks will come from Financials. This week, 44 S&P 500 companies will report their profit results, including Bank of America, Morgan Stanley, U.S. Bancorp, Johnson & Johnson, and United Airlines. From a broader perspective, S&P 500 earnings per share (EPS) is expected to grow for the third straight quarter. According to FactSet estimates, analysts expect overall Q1’24 S&P 500 EPS to come in higher by +3.6% year-over-year on revenue growth of +3.4%. The upcoming earnings season will provide investors with key updates on how businesses took advantage of a still growing economy and reduced inflation pressures in the first quarter. Given the profit bar fell for S&P 500 companies in aggregate during the first quarter, we anticipate S&P 500 companies to modestly hurdle over Q1 EPS expectations as economic activity during the first quarter was solid. That said, we believe outlooks for the second quarter could lean cautious across a variety of industries, as we expect the demand backdrop to further normalize this year and consumers and businesses to become more price-sensitive over time.
Notably, Big Tech will again be in the crosshairs of investors this earnings season. In our view, companies in this exclusive group will likely need to meet and probably surpass analyst estimates to keep their stock prices climbing higher while providing a continued view that growth remains on an upward trajectory this year.
Over the coming weeks, profit updates and outlooks from corporate America could provide a much-needed re-grounding in the health of business conditions both here and abroad. Importantly, a focus on corporate profit trends for a few weeks could also help investors move beyond the macroeconomic and policy loop (at least temporarily) and into a company-by-company focus, which at times can be informative in uncovering new trends or confirming or contrasting existing market narratives.
Other items of focus this week include March Retail Sales, a batch of home data, and an updated look at U.S. Leading Indicators.
These figures are shown for illustrative purposes only and are not guaranteed. They do not reflect taxes or investment/product fees or expenses, which would reduce the figures shown here. An index is a statistical composite that is not managed. It is not possible to invest directly in an index. Past performance is not a guarantee of future results.
Sources: FactSet and Bloomberg. FactSet and Bloomberg are independent investment research companies that compile and provide financial data and analytics to firms and investment professionals such as Ameriprise Financial and its analysts. They are not affiliated with Ameriprise Financial, Inc.
The views expressed are as of the date given, may change as market or other conditions change, and may differ from views expressed by other Ameriprise Financial associates or affiliates. Actual investments or investment decisions made by Ameriprise Financial and its affiliates, whether for its own account or on behalf of clients, will not necessarily reflect the views expressed. This information is not intended to provide investment advice and does not account for individual investor circumstances.
Some of the opinions, conclusions and forward-looking statements are based on an analysis of information compiled from third-party sources. This information has been obtained from sources believed to be reliable, but accuracy and completeness cannot be guaranteed by Ameriprise Financial. It is given for informational purposes only and is not a solicitation to buy or sell the securities mentioned. The information is not intended to be used as the sole basis for investment decisions, nor should it be construed as advice designed to meet the specific needs of an individual investor.
Stock investments involve risk, including loss of principal. High-quality stocks may be appropriate for some investment strategies. Ensure that your investment objectives, time horizon and risk tolerance are aligned with investing in stocks, as they can lose value.
The products of technology companies may be subject to severe competition and rapid obsolescence, and their stocks may be subject to greater price fluctuations.
Past performance is not a guarantee of future results.
An index is a statistical composite that is not managed. It is not possible to invest directly in an index.
Definitions of individual indices and sectors mentioned in this article are available on our website at ameriprise.com/legal/disclosures in the Additional Ameriprise research disclosures section.
The Dow Jones Industrial Average (DJIA) is an index containing stocks of 30 Large-Cap corporations in the United States. The index is owned and maintained by Dow Jones & Company.
The Standard & Poor’s 500 Index (S&P 500® Index), an unmanaged index of common stocks, is frequently used as a general measure of market performance. The index reflects reinvestment of all distributions and changes in market prices but excludes brokerage commissions or other fees.
The NASDAQ composite index measures all NASDAQ domestic and international based common type stocks listed on the Nasdaq Stock Market.
The Russell 2000 Index measures the performance of the small-cap segment of the US equity universe. The Russell 2000 is constructed to provide a comprehensive and unbiased small-cap barometer and is completely reconstituted annually to ensure larger stocks do not distort the performance and characteristics of the true small-cap opportunity set. The Russell 2000 includes the smallest 2000 securities in the Russell 3000.
The US Dollar Index (USDX) indicates the general international value of the USD. The USDX does this by averaging the exchange rates between the USD and major world currencies. This is computed by using rates supplied by approximately 500 banks.
The Consumer Price Index (CPI) is an inflation indicator that measures the change in the total cost of a fixed basket of products and services, including housing, electricity, food, and transportation. The CPI is published monthly by the Commerce Department and is also commonly referred to as the cost-of-living index.
University of Michigan Consumer Sentiment Survey is a rotating panel survey based on a nationally representative sample of households in the coterminous U.S. The minimum monthly change required for significance at the 95% level in the Sentiment Index is 4.8 points; for Current and Expectations Index the minimum is 6.0 points.
Producer Price Index (PPI) measures change in the prices paid to U.S. producers of goods and services. It is a measure of inflation at the wholesale level. The index is published monthly by the U.S. Bureau of Labor Statistics (BLS).
West Texas Intermediate (WTI) is a grade of crude oil commonly used as a benchmark for oil prices. WTI is a light grade with low density and sulfur content.
The National Federation of Independent Business (NFIB) Small Business Optimism Index is a composite of ten seasonally adjusted components. It provides a indication of the health of small businesses in the U.S., which account of roughly 50% of the nation's private workforce.
Third party companies mentioned are not affiliated with Ameriprise Financial, Inc.
Investment products are not insured by the FDIC, NCUA or any federal agency, are not deposits or obligations of, or guaranteed by any financial institution, and involve investment risks including possible loss of principal and fluctuation in value.
Securities offered by Ameriprise Financial Services, LLC. Member FINRA and SIPC.