As NVIDIA takes center stage this week, is Big Tech getting “too big”?
ANTHONY SAGLIMBENE – CHIEF MARKET STRATEGIST, AMERIPRISE FINANCIAL
WEEKLY MARKET PERSPECTIVES — August 25, 2025

Stocks closed last week on a high note, following five consecutive days of declines amid mixed headlines and data. Fed Chair Powell's speech at Jackson Hole on Friday, which opened the door for a September rate cut, sent major averages higher and the Dow Jones Industrials Average to a fresh high.
Earnings reports from NVIDIA and several retailers line the week, as does home data, consumer confidence, a second look at Q2 GDP and PCE inflation.
Last week in review:
-
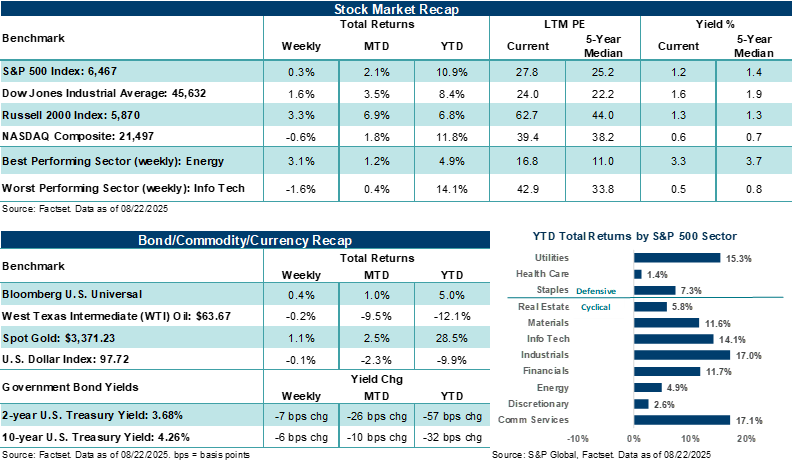
The S&P 500 Index rose +0.3% (third straight week higher), while the NASDAQ Composite dropped 0.6% (its first week lower in three weeks). Despite strong performance on Friday, both indexes were weighed down during the week by Information Technology (-1.6%) and Communication Services (-0.9%).
-
The Dow Jones Industrials Average rose +1.6% and the Russell 2000 Index gained +3.3%. Both indexes experienced strong gains on Friday amid increasing prospects for lower interest rates later this year.
- U.S. Treasury prices were firmer across the curve, the U.S. Dollar Index finished near the flatline, Gold ended higher, and West Texas Intermediate (WTI) crude edged lower.
- Fed Chair Powell delivered a dovish tilt to his last Jackson Hole address on Friday, increasing the odds of a 25-basis-point rate cut at the September meeting. Mr. Powell noted that the shifting balance of risks between growth and inflation may warrant adjusting policy. Bottom line: Absent a material and unexpected rise in employment or inflation ahead of the September meeting, the Fed is more likely than not to cut its policy rate next month for the first time since December.
- Retail earnings reports pointed to still healthy underlying consumer trends though several retailers pointed to lower and middle-income consumers seeing outsized pressure. Trade-down effects among consumers and current and delayed tariff impacts on supply chains and pricing colored several reports and outlooks. Bottom line: Tariffs will likely continue to filter through to consumer prices over time and companies are mitigating pressures where they can to protect margins.
- August preliminary manufacturing and services activity beat expectations and continuing jobless claims rose to their highest level since November 2021.
- In Washington, the Trump administration took a 10% stake in Intel, threatened to fire Fed Governor Lisa Cook, and launched an investigation into imported furniture, opening the door to increased tariffs later this year.
“So, is Big Tech "too big"? In our view, concentration risk is real and rising. Valuations are elevated. And the margin for error is shrinking. These dynamics could create near-term air pockets from time to time. However, the same forces that pushed these mega-cap tech companies to the top of the S&P 500 continue. The onus now is on execution.”
Anthony Saglimbene - Chief Market Strategist, Ameriprise Financial
With all eyes on NVIDIA this week, is Big Tech "too big"?
Through several measures, Big Tech has become very influential in the market. For instance, the S&P 500 Information Technology Index now carries roughly a 33.5% market‑cap weight within the broader S&P 500, territory last seen during the dot‑com era. NVIDIA, Microsoft, and Apple together account for 21% of the S&P 500 on their own. Add in Amazon, Meta Platforms, and Alphabet, and you're at nearly 32% across just six companies. That level of concentration suggests these stocks don't just influence the market, but they increasingly drive the overall direction of travel. In isolation, that could be a caution flag. Valuations across Big Tech are also elevated by historical standards. As an example, the NASDAQ Composite's trailing and forward price-to-earnings ratios sit well above longer‑term averages, another warning sign on its own. But context matters.
We believe Big Tech's market cap heft and elevated valuations today are supported by unusually strong profitability and cash flow generation relative to almost every other corner of the market. With earnings reports for the previous quarter largely complete, Q2'25 Information Technology earnings per share (EPS) grew +21.6% year-over-year, and Communication Services posted an eye-popping +45.6% annual growth rate, both head-and-shoulders above the S&P 500's +11.7% EPS growth rate. Looking forward, Info Tech is expected to grow profits by +19.3% in the current quarter versus roughly +7.0% for the S&P 500. In our view, outsized profit growth can reasonably command outsized valuations, particularly when secular demand themes (i.e., AI infrastructure, cloud, and software spend) are compounding at outsized rates. Notably, stronger-than-average profit trends also help explain a longer arc of rising technology exposure within the S&P 500 since the dot‑com bust over the last 25 years. Outside of brief downturns, Big Tech as an aggregate has "earned" a larger share of the S&P 500 by growing faster, running with higher margins, and delivering better investor returns than most sectors.
Even so, elevated expectations raise the bar. The Magnificent Seven (i.e., Apple, Amazon, Alphabet, Microsoft, Meta Platforms, NVIDIA, and Tesla) have disproportionately powered the market for roughly two years, and the group is now about as expensive as it's been since the AI cycle kicked off in late 2022. On price‑to‑earnings, price‑to‑book, price‑to‑cash flow, and price‑to‑sales, the group screens richer than its two‑ and five‑year averages, with price‑to‑sales and price‑to‑cash flow looking especially stretched. Yes, profit growth has been strong, often surpassing quarterly estimates, which helps rationalize some of the premiums the group carries. But premium multiples demand continued execution, and the law of large numbers usually shortens the runway for easy comparisons, while margin tailwinds begin to normalize. Thus, beat‑and‑raise quarters become incrementally harder each quarter.
That backdrop amplifies the focus on NVIDIA's earnings report this week. NVIDIA will be the last of the Magnificent Seven to post its prior quarter results, due on Wednesday after the close. The stock is up +32.5% year-to-date and is far outpacing the S&P 500's +10.0% gain. Demand from hyperscalers and large enterprises for AI accelerators, networking and the surrounding software ecosystem has allowed NVIDIA to top analyst profit estimates for multiple quarters. Coupled with positive AI‑related results and outlooks from Microsoft, Alphabet, Meta, and Amazon this earnings season, the setup argues for another solid quarter of results and a constructive outlook. However, expectations for NVIDIA keep ratcheting higher, year‑over‑year comparisons are becoming more difficult to top, and margin dynamics have tightened – factors that have already tempered the magnitude of recent profit beats. In addition to NVIDIA's results and broader outlook, investors will be watching for color on U.S. policy actions affecting roughly 15% of the chipmaker's China‑related semiconductor revenue, including headlines suggesting China's demand for its H20 chips is declining. In addition, competitive dynamics, supply chain updates, and AI software monetization will also be focal points for investors. With the spotlight bright on NVIDIA this week, surprises, either positive or negative, could carry outsized influence on the stock and overall market.
Nevertheless, recent market action suggests investors have reduced some of the risk premium across Big Tech ahead of NVIDIA's results this week. In August, Information Technology is up just +0.3%, versus a +2.0% gain for the S&P 500 Index. Rotational trading away from Big Tech and a little profit‑taking after a strong multi‑month run from the April lows has created a mild reset across the group. And until Friday's big gains, market jitters around some technology stocks included familiar concerns such as the market's concentration in a handful of names, whether AI capex is overheating, the pace of monetization outside the biggest infrastructure players and rising competitive pressure from China. Headlines around uneven AI product rollouts and a still‑evolving path to broad‑based AI benefits across industries only added to the near‑term jitters. Of course, for "speculative" AI‑adjacent stocks, investors should expect sharper drawdowns during periods of investor doubt as price adjusts to fundamentals. That said, we believe the core fundamentals of Technology (i.e., multi‑year AI infrastructure buildouts, cloud optimization that increasingly includes AI, and software integration across industries over time) remain intact.
So, is Big Tech "too big"? In our view, concentration risk is real and rising. Valuations are elevated. And the margin for error is shrinking. These dynamics could create near-term air pockets from time to time. However, the same forces that pushed these mega-cap tech companies to the top of the S&P 500 (e.g., superior growth, superior margins, and superior cash flow generation) continue. The onus now is on execution. In our view, prudent investors should maintain a slight overweight to high‑quality Tech, particularly firms with clear AI cash‑flow generation, wide moats, and line‑of‑sight into recurring revenue, while deliberately making space for areas such as Financials and Utilities that enjoy their own cyclical or structural tailwinds. We believe diversified portfolios, with modest over‑ and underweights, rather than all‑or‑nothing positions, tend to travel well across complex macroeconomic backdrops. Heading into NVIDIA's results this week, investors should recognize that the company's influence extends beyond itself. Its commentary on Wednesday could help set the table for how AI trends develop into year-end and, by extension, for a market now anchored to a small group of very large and influential technology stocks.
The week ahead:
-
Along with NVIDIA, Best Buy, Dollar General, Ulta Beauty, and Dell Technologies, help wind down the Q2 earnings season.
-
August Consumer Confidence and home data throughout the week should add more color to consumer sentiment.
- A second look at Q2 GDP and the July Personal Consumption Expenditures (PCE) Price Index are other items of note, but they are unlikely to meaningfully drive market direction this week.