Does timing the market ever pay? Here’s what the data says
Mark Phelps, Senior Director of Manager Research – Ameriprise Financial

Nov. 20, 2023
Trying to time the market can be enticing to even the most experienced investors. After all, who doesn’t want to make the most of their money and maximize their gains?
However, long-term investors routinely do themselves a disservice by attempting this feat.
As we’ll show through our analysis below, those who seek to time active and passive funds generally underperform the market — from large-cap to small-cap, domestic to foreign, and across equities and fixed income.
Total return vs. investor return
To prove out our hypothesis that market timing leads to suboptimal performance, we’ll compare total returns to investor returns across four Morningstar fund categories: U.S. equity capitalizations, growth and value securities, foreign equity markets and fixed income.
Comparing total returns and investor returns informs us about the success — or lack thereof — of investor cash flow decisions. Here’s why:
- Total return: The total return of various investment vehicles, including mutual funds, exchange-traded funds (ETFs), and model portfolios, is mostly provided as a “time-weighted weight of return.” That is, the performance figure provided for any given time frame would equal an investor’s actual return if the investor contributed a single lump sum at the beginning of the period and held it without any subsequent contributions or withdrawals over the entire period.
- Investor return: Total return doesn’t always represent an investor’s real-world experience because they often contribute more funds over time, and they often move funds between investments to “time the market.” To capture the effects of cash flows, one can also calculate a “money-weighted rate of return,” which is known as “investor return.”
A hypothetical scenario
Consider a hypothetical investment in a mutual fund of $100 for three years. In the first year, the fund’s total return was 5%, the second year was also 5% and the third was -5%. The cumulative total return over the three years would’ve been 4.7%.
But what if the investor contributed another $100 at the end of the second year, just before the -5% year? The investor’s cumulative return would’ve been just 2.4% because there was less money invested during the positive years than there was in the negative year.

Comparing returns across 4 different Morningstar fund categories
Morningstar publishes both total returns (time-weighted) and investor returns, which approximates the average money-weighted rate of return by incorporating monthly fund flows. Here’s a look at how total returns and investor returns compare across a variety of Morningstar funds in a variety of markets.

Past performance is not a guarantee of future results.
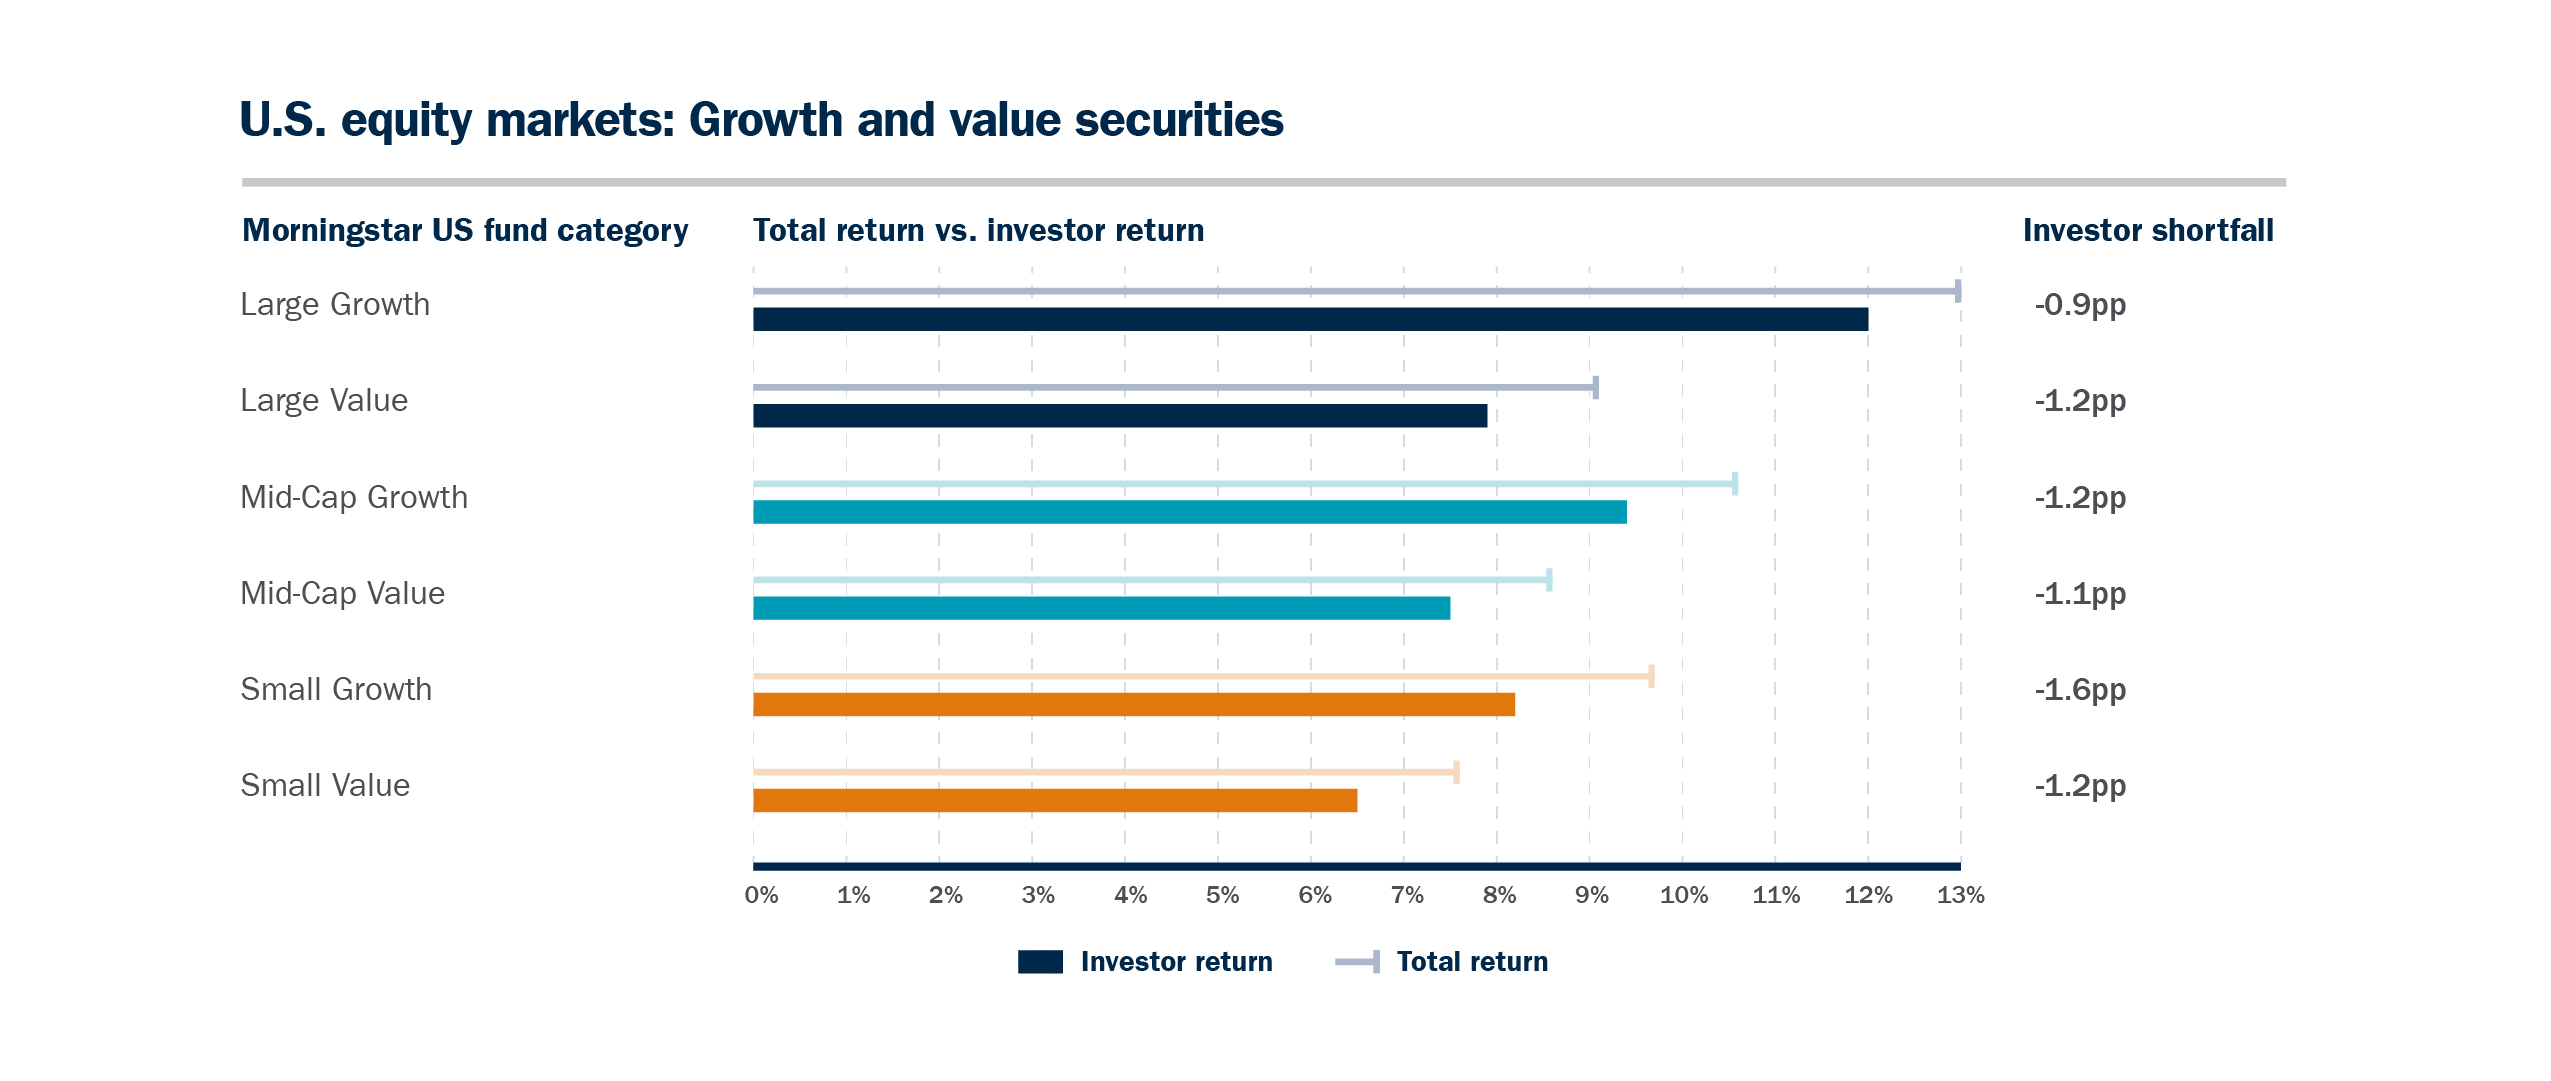
As you can see, investors generally did not capture the full total return potential of equity investments across U.S. equity market capitalizations over the past 10 years. Since these markets were broadly positive over the period, we can surmise this was due to suboptimal tactical allocation — or market timing — rather than unfortunate timing of contributions, as described in the hypothetical example above.

Past performance is not a guarantee of future results.
In addition to tactically adjusting allocation across company sizes, investors often over- or underweight equity styles. As we can see in the chart above, investors were less successful at allocating between growth and value securities across capitalizations over the past 10 years.

Past performance is not a guarantee of future results.
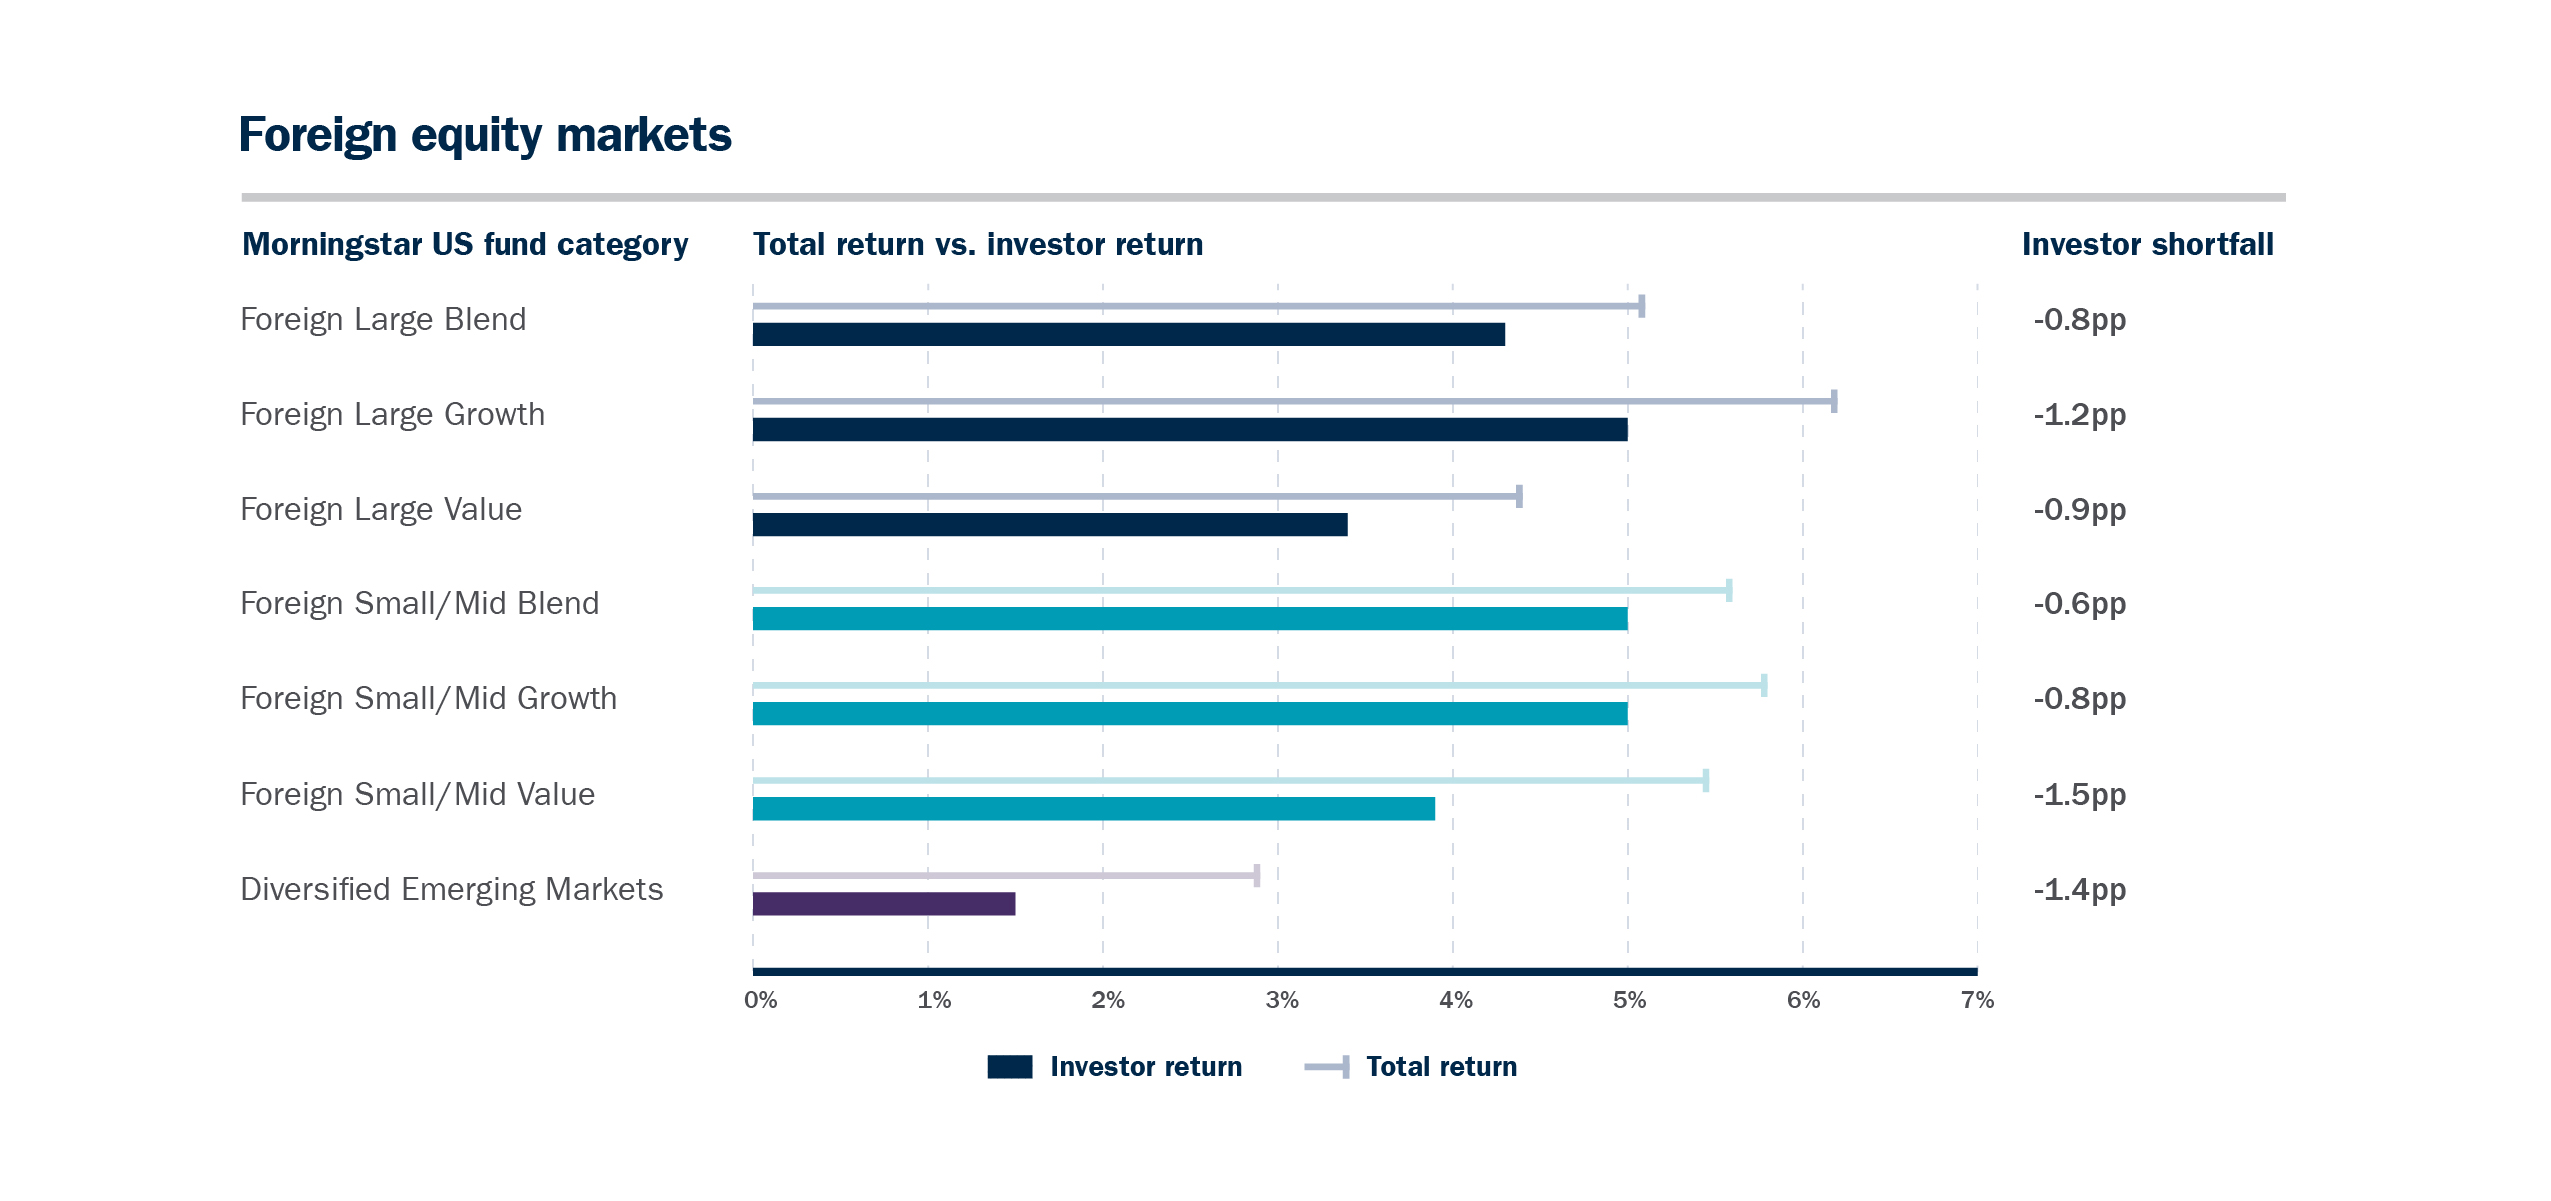
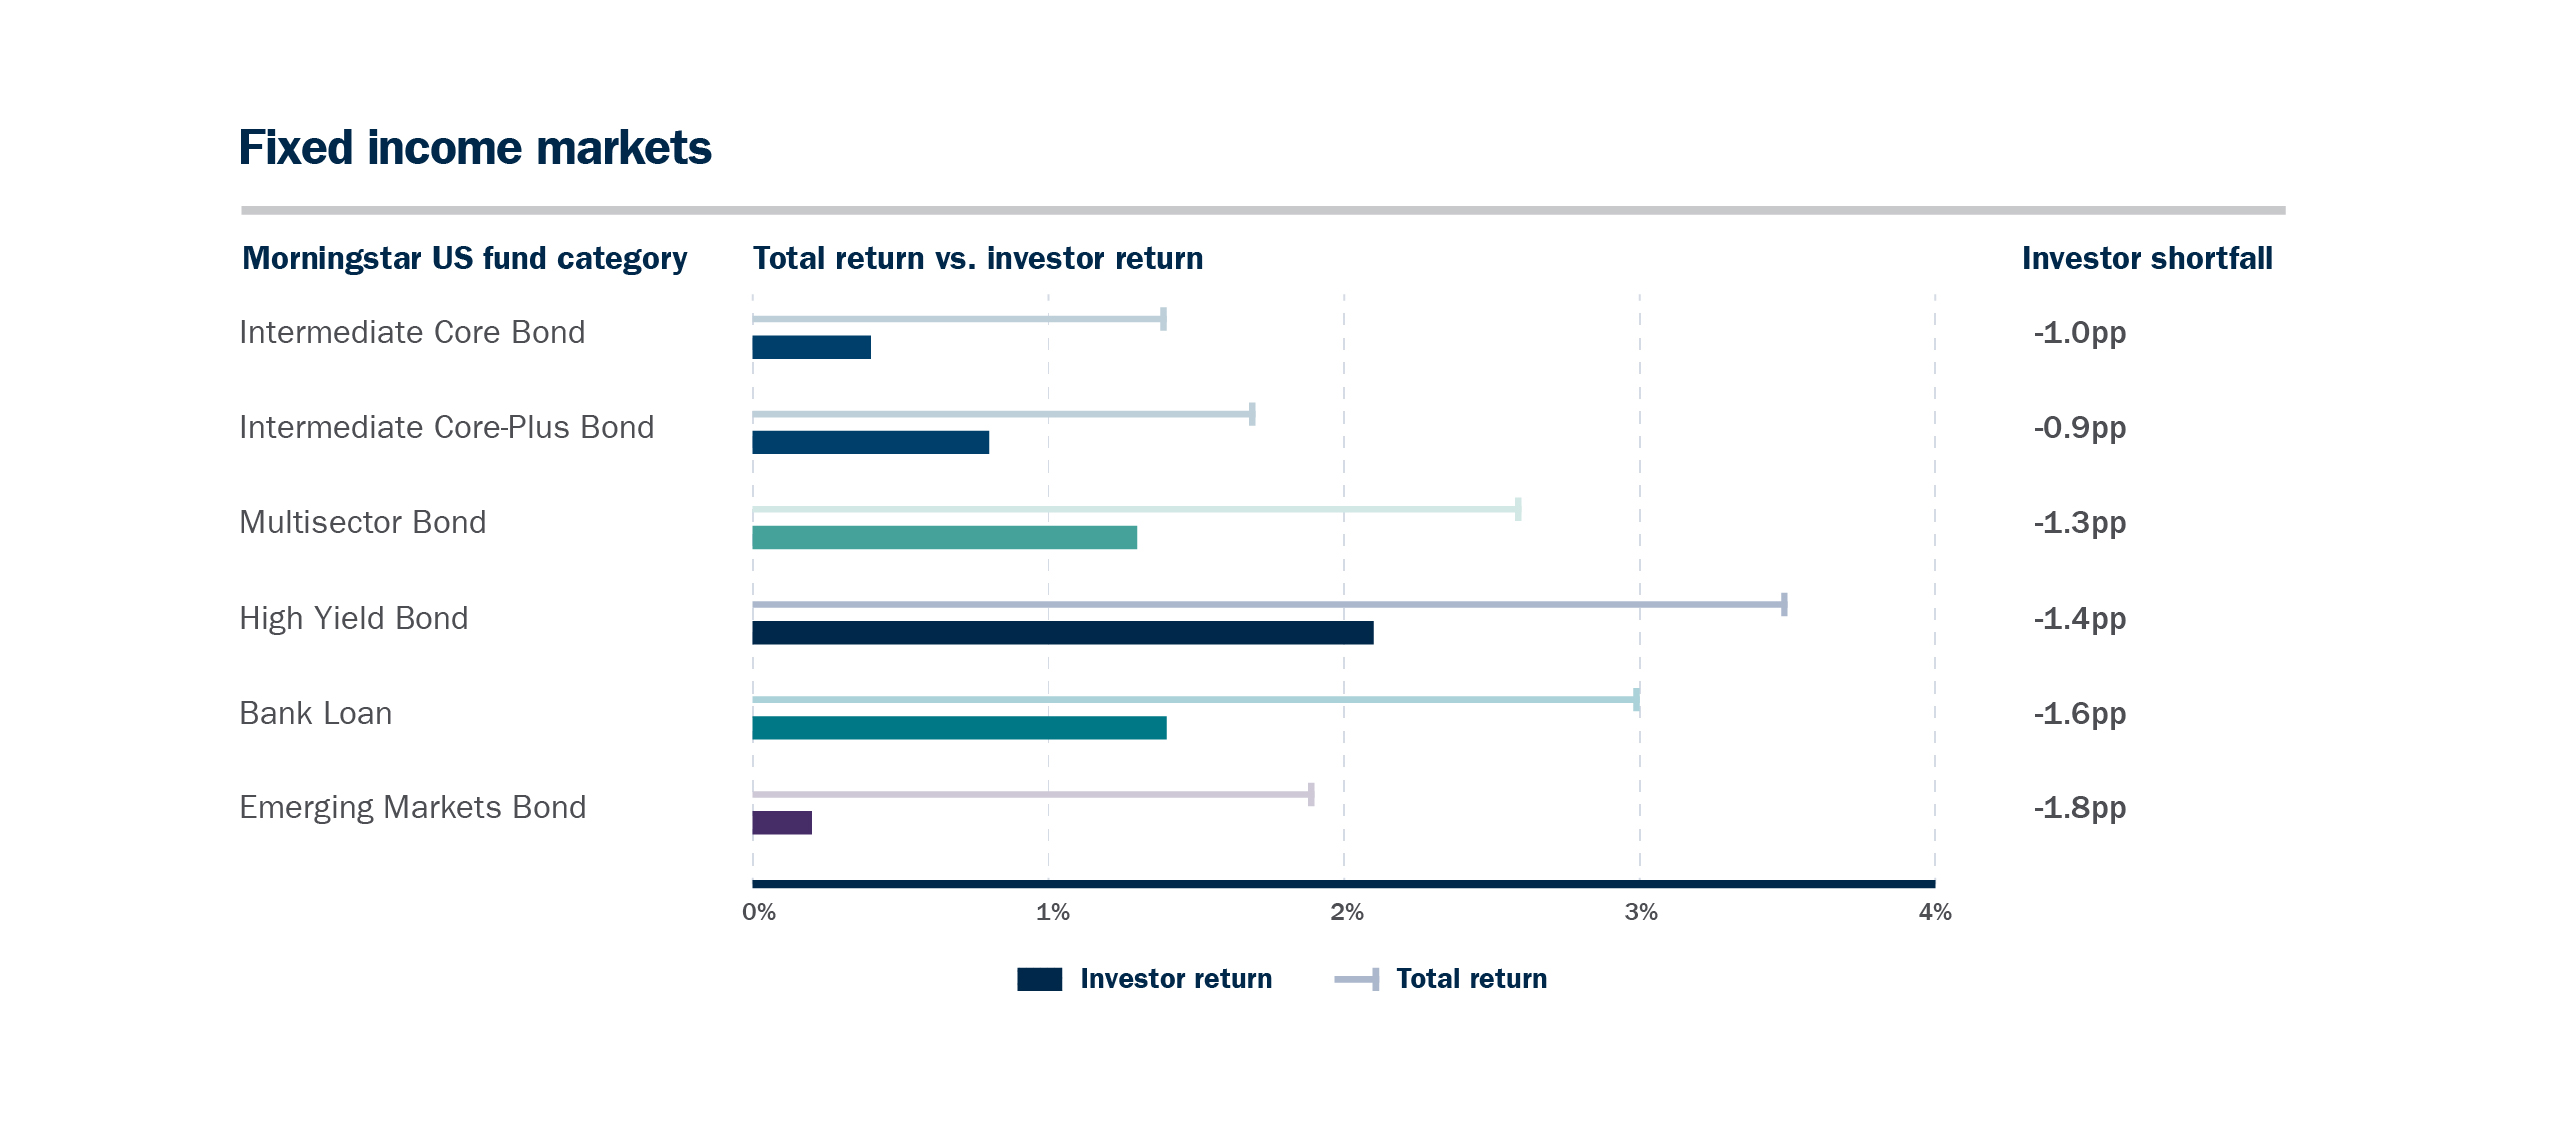
Investors also performed poorly at timing foreign equity markets (above) and fixed income markets (below).

Past performance is not a guarantee of future results.
Bottom line
The Morningstar categories above include both actively managed mutual funds and ETFs, the majority of which are passively managed approaches. Morningstar’s own analysis has shown that investor shortfalls are larger for passive funds, relative to active funds. Given ETFs and other passive funds are commonly used for tactical asset allocation, this is unsurprising. And investors’ use of sector funds has been even more unfavorable: The 10-year shortfall across active sector funds was -3.3 percentage points as of Dec. 31, 2022, and a whopping -5.0 pp with passive sector funds.
Patient, long-term investing can be a sound approach for many investors
While market timing may be tempting, data shows that a patient, long-term investing strategy that adheres to strategically focused asset allocation approaches may be smart for many people saving and investing for retirement. Investors may benefit from adjusting portfolios to account for shorter-term risks and opportunities. If you have questions about how your investment strategy is aligned to your financial goals, reach out to your Ameriprise financial advisor.
The views expressed are as of the date given, may change as market or other conditions change, and may differ from views expressed by other Ameriprise Financial associates or affiliates. Actual investments or investment decisions made by Ameriprise Financial and its affiliates, whether for its own account or on behalf of clients, will not necessarily reflect the views expressed. This information is not intended to provide investment advice and does not account for individual investor circumstances.
Some of the opinions, conclusions and forward-looking statements are based on an analysis of information compiled from third-party sources. This information has been obtained from sources believed to be reliable, but accuracy and completeness cannot be guaranteed by Ameriprise Financial. It is given for informational purposes only and is not a solicitation to buy or sell the securities or strategies mentioned.
The information is not intended to be used as the sole basis for investment decisions, nor should it be construed as advice designed to meet the specific needs of an individual investor.
The Morningstar Category classifications break portfolios into peer groups based on their holdings. Portfolios are placed in a given category based on their average holdings statistics over the past three years. If the portfolio is new and has no history, Morningstar estimates where it will fall before giving it a more permanent category assignment. When necessary, Morningstar may change a category assignment based on recent changes to the portfolio.
Total return measures what investors could have earned had they bought and held the funds represented in the Morningstar category, reinvesting all dividends, over a period of time.
Morningstar® Investor Return™ captures how the average investor fared in a fund category over a period of time. It estimates the return earned collectively by all the investors in a fund. Investor return, also known as dollar-weighted return, accounts for all cash inflows and outflows from purchases and sales and the growth in fund assets. Investor return is an internal rate of return calculation that places greater emphasis on periods in which fund assets are larger.
Asset allocation does not assure a profit or protect against loss.
Ameriprise Financial cannot guarantee future financial results.
Investment products are not insured by the FDIC, NCUA or any federal agency, are not deposits or obligations of, or guaranteed by any financial institution, and involve investment risks including possible loss of principal and fluctuation in value.
Securities offered by Ameriprise Financial Services, LLC. Member FINRA and SIPC.
