Is Big Tech finally out of the woods?
ANTHONY SAGLIMBENE – CHIEF MARKET STRATEGIST, AMERIPRISE FINANCIAL
WEEKLY MARKET PERSPECTIVES — May 5, 2025

Investors would be forgiven if they thought that they somehow slipped into Doc Brown's DeLorean with Marty McFly and went back to 2024. The S&P 500 Index finished last Friday higher for the ninth straight session, its longest daily consecutive winning streak since November 2004. Consecutive winning days for the major stock averages, growth sectors leading the charge, and artificial tailwinds back in focus last week felt very reminiscent of 2024.
This week, earnings will continue to pour in, and the Federal Reserve's two-day meeting and policy decision on Wednesday will be key focal points for investors.
“Unfortunately, for the current artificial intelligence cycle, we don't have a definitive answer on whether Big Tech is out of the woods yet. However, earnings reports across the Magnificent Seven so far suggest the AI boom remains a strong secular theme that is likely to continue for the foreseeable future.”
Anthony Saglimbene - Chief Market Strategist, Ameriprise Financial
Shown for illustrative purposes only. An index is a statistical composite that is not managed. It is not possible to invest directly in an index. Past performance is not a guarantee of future results.
Last week in review:
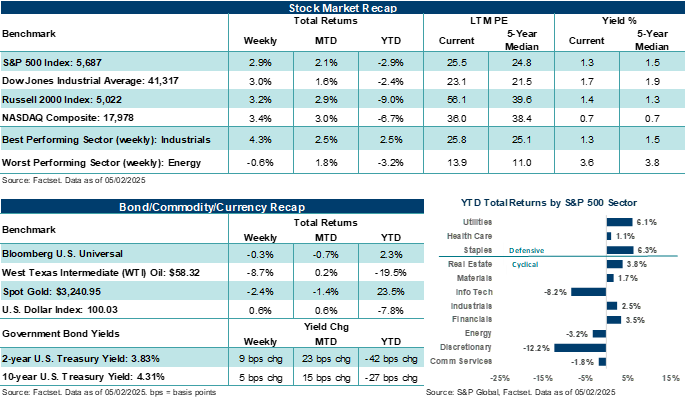
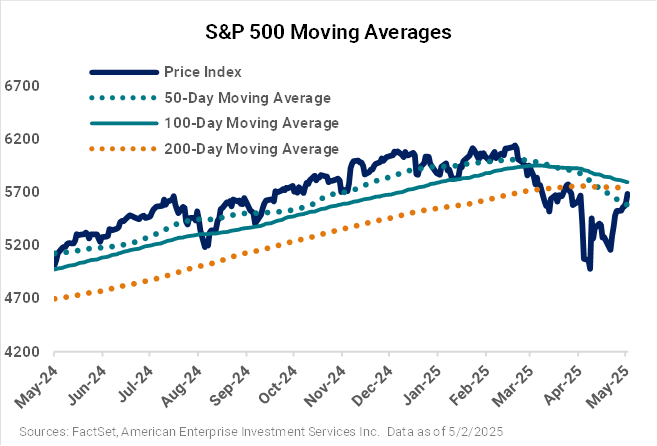
- The S&P 500 (+2.9%) posted its second consecutive week of gains. The Index is down just 7.5% from its February high after falling almost 20% from the high in early April. Notably, the major U.S. stock average is down less than 3.0% in 2025 despite all the volatility this year.
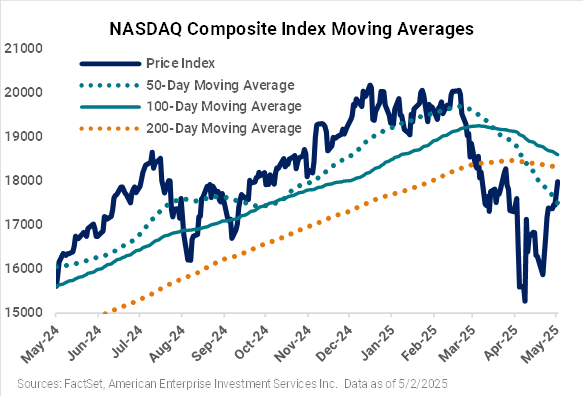
- The NASDAQ Composite gained +3.4% on the week. The Tech-heavy benchmark has recovered about half of its losses from the December peak to the April trough.
- Speaking of Tech, Magnificent Seven earnings last week were generally solid all around and, for the most part, helped lift major indexes. For Microsoft, Azure growth accelerated in Q1, and the company sees its outsized capital expenditures (capex) continuing, somewhat putting to rest the idea that spending on artificial intelligence is slowing down amid the tariff uncertainty. For Meta Platforms, the company upwardly revised its capex (notably for data center investments), sees healthy trends in April despite tariff headwinds in China, and is focusing on its AI roadmap (including advertising, engaging experiences, Meta AI, and AI devices).
- However, the story was a little more complicated for Apple and Amazon. Apple saw iPhone growth accelerating in the previous quarter. Still, services revenue disappointed expectations, growth in China was a weak spot, the company provided ho-hum guidance and said it expects to take a $900 million hit in the current quarter due to tariff impacts. In addition, Amazon's revenue during the previous quarter came in largely in line with estimates, but AWS revenue growth was a tad light, the outlook was below what analysts were looking for, and tariff uncertainty weighed on guidance, even though the company said demand has been solid across its platform. In addition, while AWS' growth was light, easing capacity constraints in the second half and strong margin expansion across the cloud business were notably positive.
- All in all, investors got what they needed from these key companies on the earnings front, helping to lift sentiment.
- The Dow Jones Industrials Average (+3.0%) and Russell 2000 Index (+3.2%) also posted solid gains.
- U.S. Treasury prices edged lower as yields rose. West Texas Intermediate (WTI) crude finished below $60 per barrel. The U.S. Dollar Index rose, and Gold posted its second consecutive weekly decline.
- On the economic front, data came in largely better than feared. Q1'25 GDP (-0.3%) posted its first quarter-over-quarter decline since Q1'22. However, that decline was almost entirely due to a surge in imports ahead of U.S. tariffs. Nonfarm payrolls in April came in stronger than expected (+177,000), but the prior two months of jobs were revised lower. Importantly, the unemployment rate remained at 4.2% in April, indicating employers have not adjusted their hiring calculus due to tariffs. March core PCE inflation came in cooler than expected, and April ISM manufacturing came in firmer than consensus. That said, April's consumer confidence report posted its lowest reading since the spring of 2020.
Is Big Tech finally out of the woods?
After pretty solid earnings reports from Apple, Amazon, Microsoft, and Meta Platforms last week and Alphabet the prior week, as well as outlooks that didn't rock the boat versus already guarded expectations coming into the earnings season, the NASDAQ Composite continued its push higher last week. In fact, on Thursday, the NASDAQ recovered everything it lost and then some after President Trump's reciprocal tariff announcement on April 2. On Friday, the S&P 500 joined the NASDAQ in accomplishing that feat. So, with Big Tech back on an upswing and helping push major averages higher after a slump lower in the first quarter, investors might be asking if the market's tech darlings have seen the worst of the selling pressure.

Shown for illustrative purposes only. An index is a statistical composite that is not managed. It is not possible to invest directly in an index.
Past performance is not a guarantee of future results.
Interestingly, from time to time, we like to pull out the Ameriprise chart above that compares the NASDAQ's performance following the introduction of the first modern web browser (Netscape) during the mid-90s and the introduction of ChatGPT at the end of 2022. Both of these periods offer a very similar market backdrop and one that kicked off rapid innovation across technology and tech spending. Of course, the artificial intelligence boom is still likely in its early innings. What is eerily similar in this comparison so far is how closely the NASDAQ's current performance is tracking since the launch of ChatGPT with that of its historical performance following the launch of Netscape. Notably, in each of these two periods and around the same time (based on trading days), the NASDAQ faced a swift downdraft after a period of rapid and mostly uninterrupted price appreciation. During both these periods, an increasing number of investors began questioning profit strength, sustainability in those profits, and valuations across the NASDAQ's leaders, which caused a price reset across pockets of technology. History tells us the internet boom was far from over after the NASDAQ's first major reset in the mid-90s, with the tech-heavy index going on to have several more modest corrections while grinding higher for years before accelerating into the dot com bust.
Unfortunately, for the current artificial intelligence cycle, we don't have a definitive answer on whether Big Tech is out of the woods yet. However, earnings reports across the Magnificent Seven so far suggest the AI boom remains a strong secular theme that is likely to continue for the foreseeable future. And while tech spending in other areas could come under some pressure if the economy slows and business spending is further rationalized, corporate spending on AI is unlikely to slow this year, in our view. Recent stock declines across Big Tech, somewhat improved valuations across pockets of technology, and a reconfirmation of the AI theme from key players like Microsoft, Alphabet, Meta, and Amazon suggest, at the very least, investors should be considering what the right level of Tech and growth ownership is for them based on their personal goals and risk tolerance. Moving forward, outsized earnings growth, companies' ability to meet growth expectations, and investors' confidence in the secular trends shaping Big Tech will all likely play key roles in whether this pocket of the market can recover and move to new highs. But if one finds themselves underexposed to this area (which admittedly might be a tough find given these companies' current influence across markets and products), then you may want to reach out to your Ameriprise financial advisor to discuss ways to right size positions and take advantage of what might still be a long and profitable journey in the AI boom.
The week ahead:
-
The Federal Reserve is widely expected to leave rate policy unchanged on Wednesday. Investors should expect the updated policy statement to strike a similar tone as the March statement, noting inflation remains somewhat elevated versus the Fed's target, the committee remains attentive to risks to both sides of its dual mandate, and uncertainty around the economic outlook has increased. The key question: Is June a live meeting for a rate cut?
-
With first quarter earnings coming in well ahead of expectations, 92 more S&P 500 companies will report this week and add to overall results. 76% of S&P 500 companies reporting Q1 results have surpassed analyst expectations. That said, analysts are cutting their second quarter profit estimates by wider margins than usual, given elevated recession risks.
- April ISM services, weekly jobless claims, and Q1 productivity data line a relatively light economic calendar.