What the China slowdown may mean for U.S. stocks
Jun Zhu, Senior Analyst – Ameriprise Financial
June 17, 2024


China’s gross domestic product (GDP) growth stands at its lowest level since 1990, excluding the pandemic-impacted years. With forecasters anticipating continued slowdowns this year and next, the country’s reputation as a pivotal driver of global economic growth is being called into question.
The potential repercussions of this downshift are notable, affecting commodity prices, the country’s domestic housing market and global trade dynamics. And for U.S. investors, one additional question is particularly pertinent: What impact might a decelerating China have on U.S.-listed companies that are based in, operate in or sell into its market?
A downshift in economic activity
Over the last 30 years, the economy in China has been growing faster than most other major economies, including the United States (see the gold line in the chart below). However, China’s reported GDP rate1 of 5.2% in 2023 has sparked some concern among investors. Despite surpassing the previous year’s rate of +3.0%, analysts are comparing the country’s current growth environment against pre-pandemic trends. Excluding the three anomalous years affected by the pandemic, the growth rate of 5.2% in 2023 represents a deceleration from 2019’s rate of +5.9% — at the time, the slowest pace in nearly two decades. Further, this declining trend is observable both in absolute terms and when compared with the relatively stable growth metrics of the U.S. While China’s growth still outpaces that of the United States the margin here has been shrinking, and hence the benefits accrued for companies with exposure to China could start diminishing.
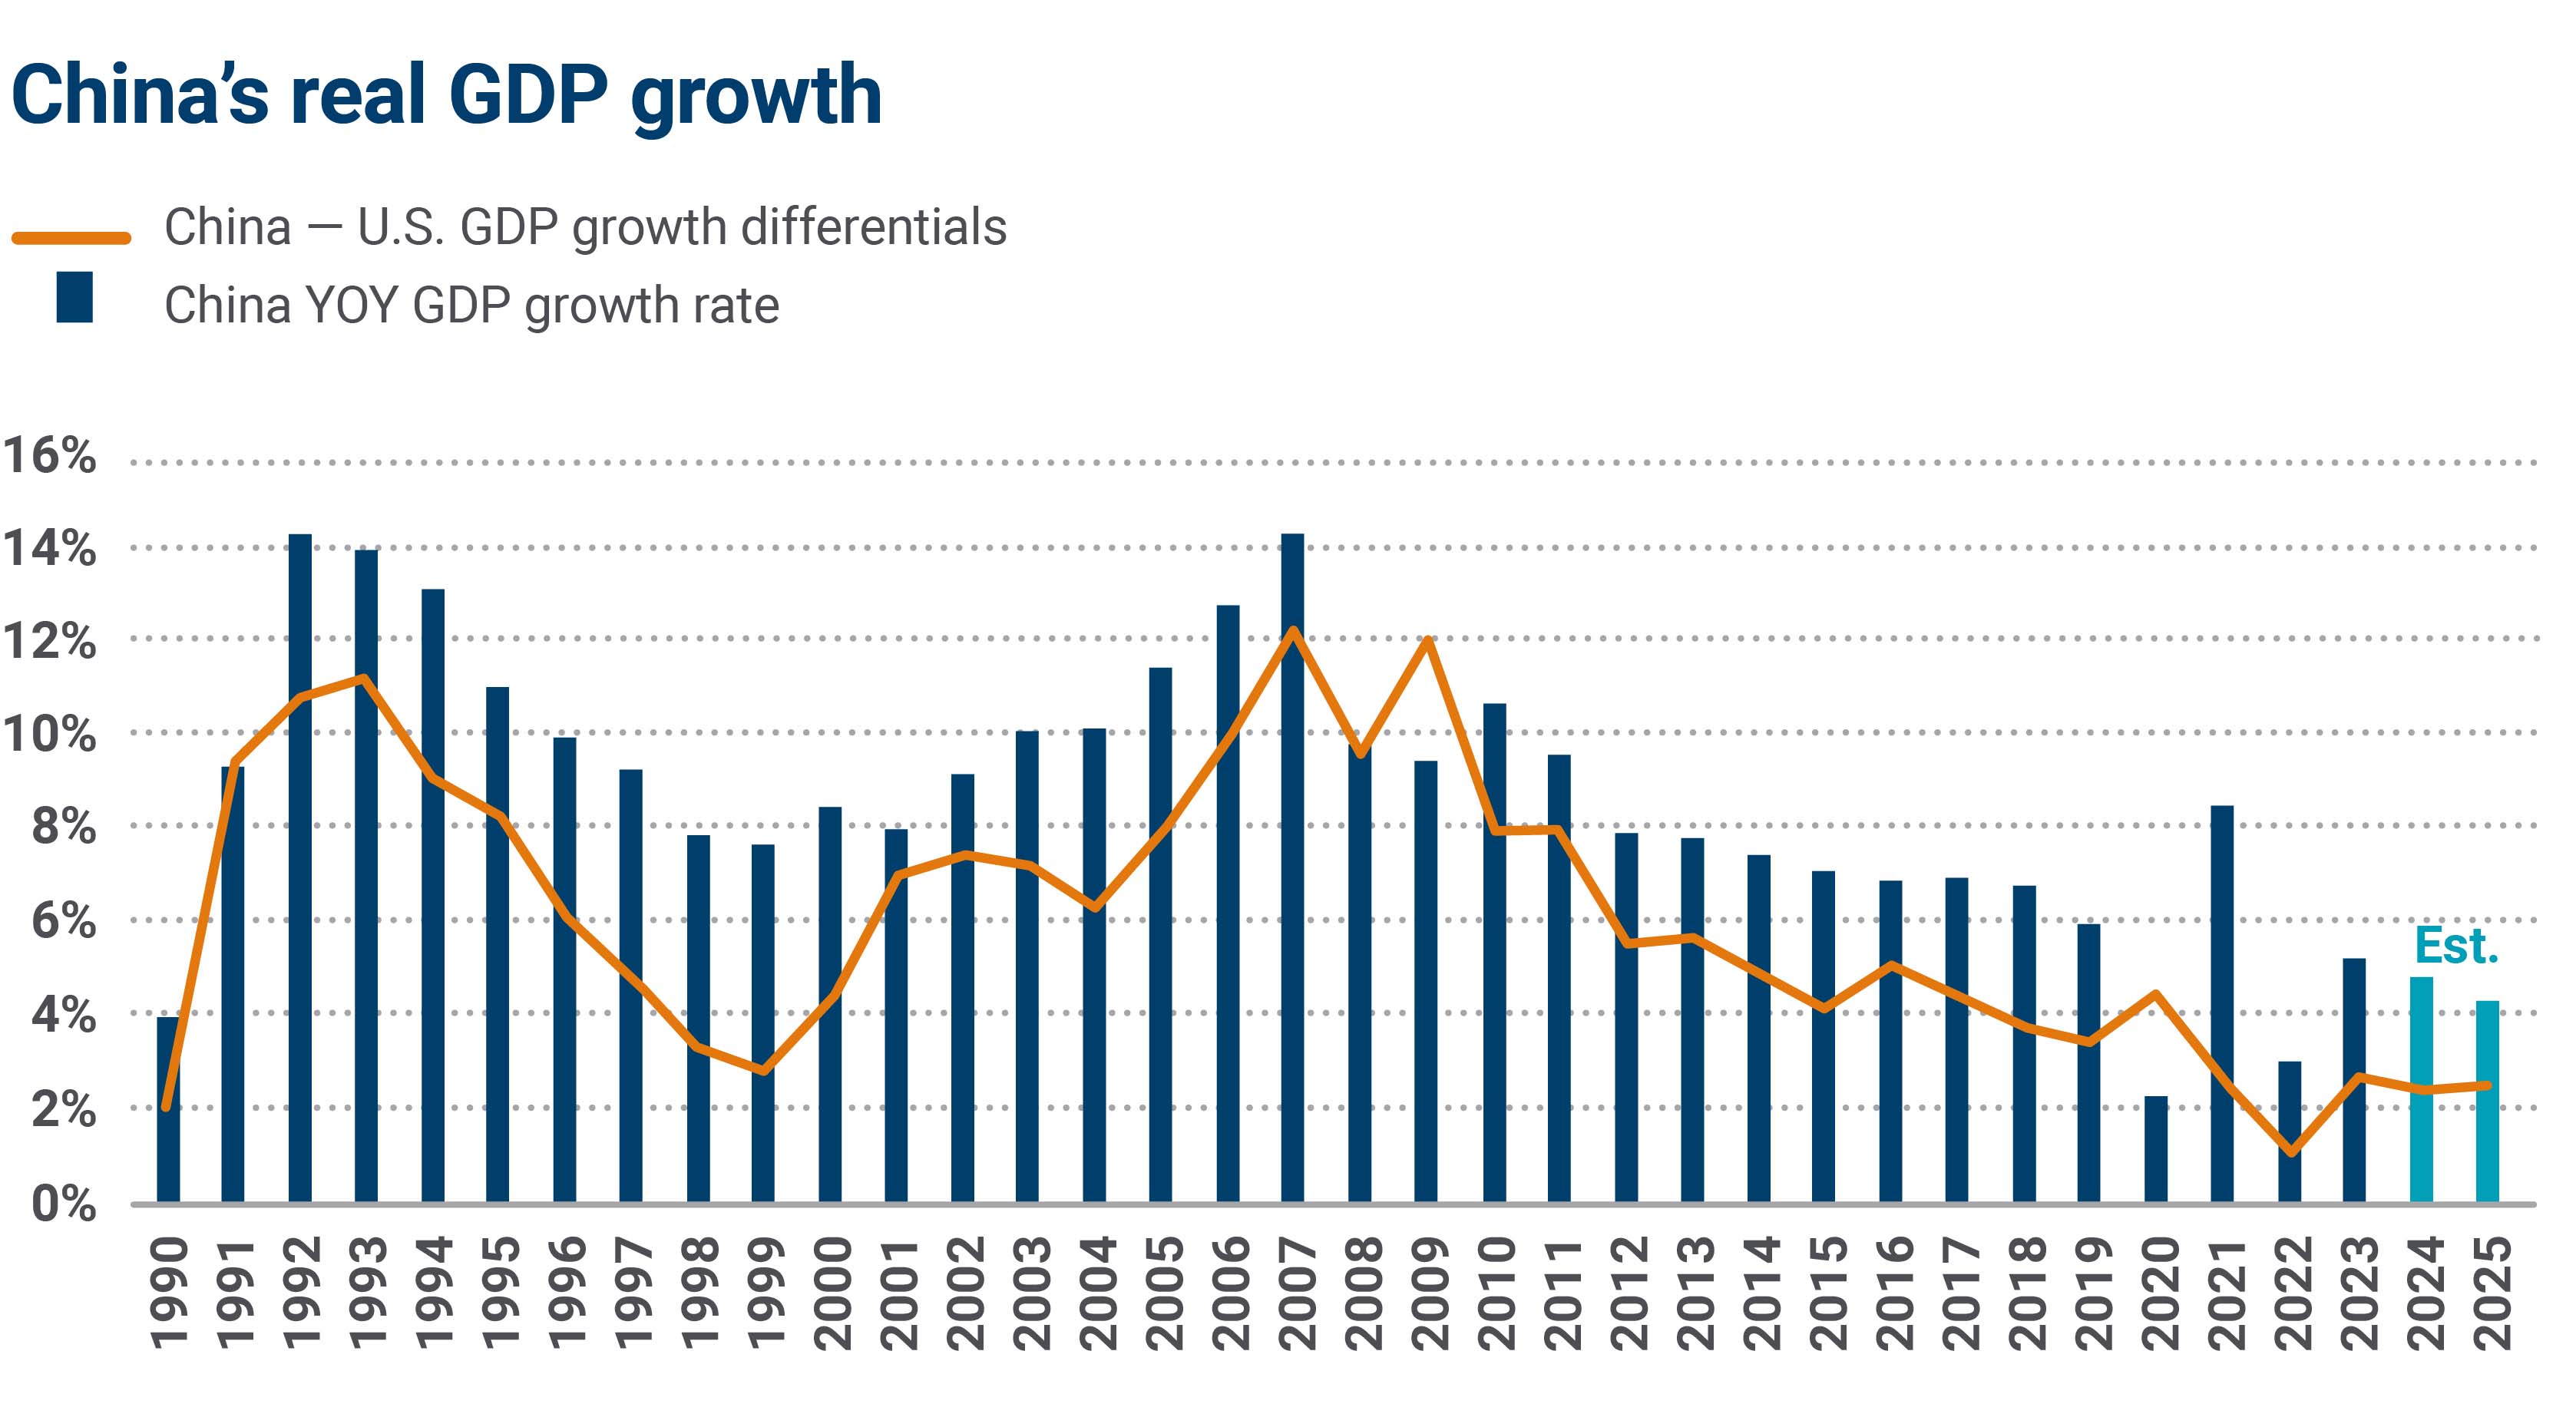
Source: FactSet and American Enterprise Investment Services Inc.
Exposure to China varies among sectors and industries
Approximately 4% of the total revenue for companies listed in the S&P 500 Index is derived from China, a figure that, although modest, has quadrupled since 2004.
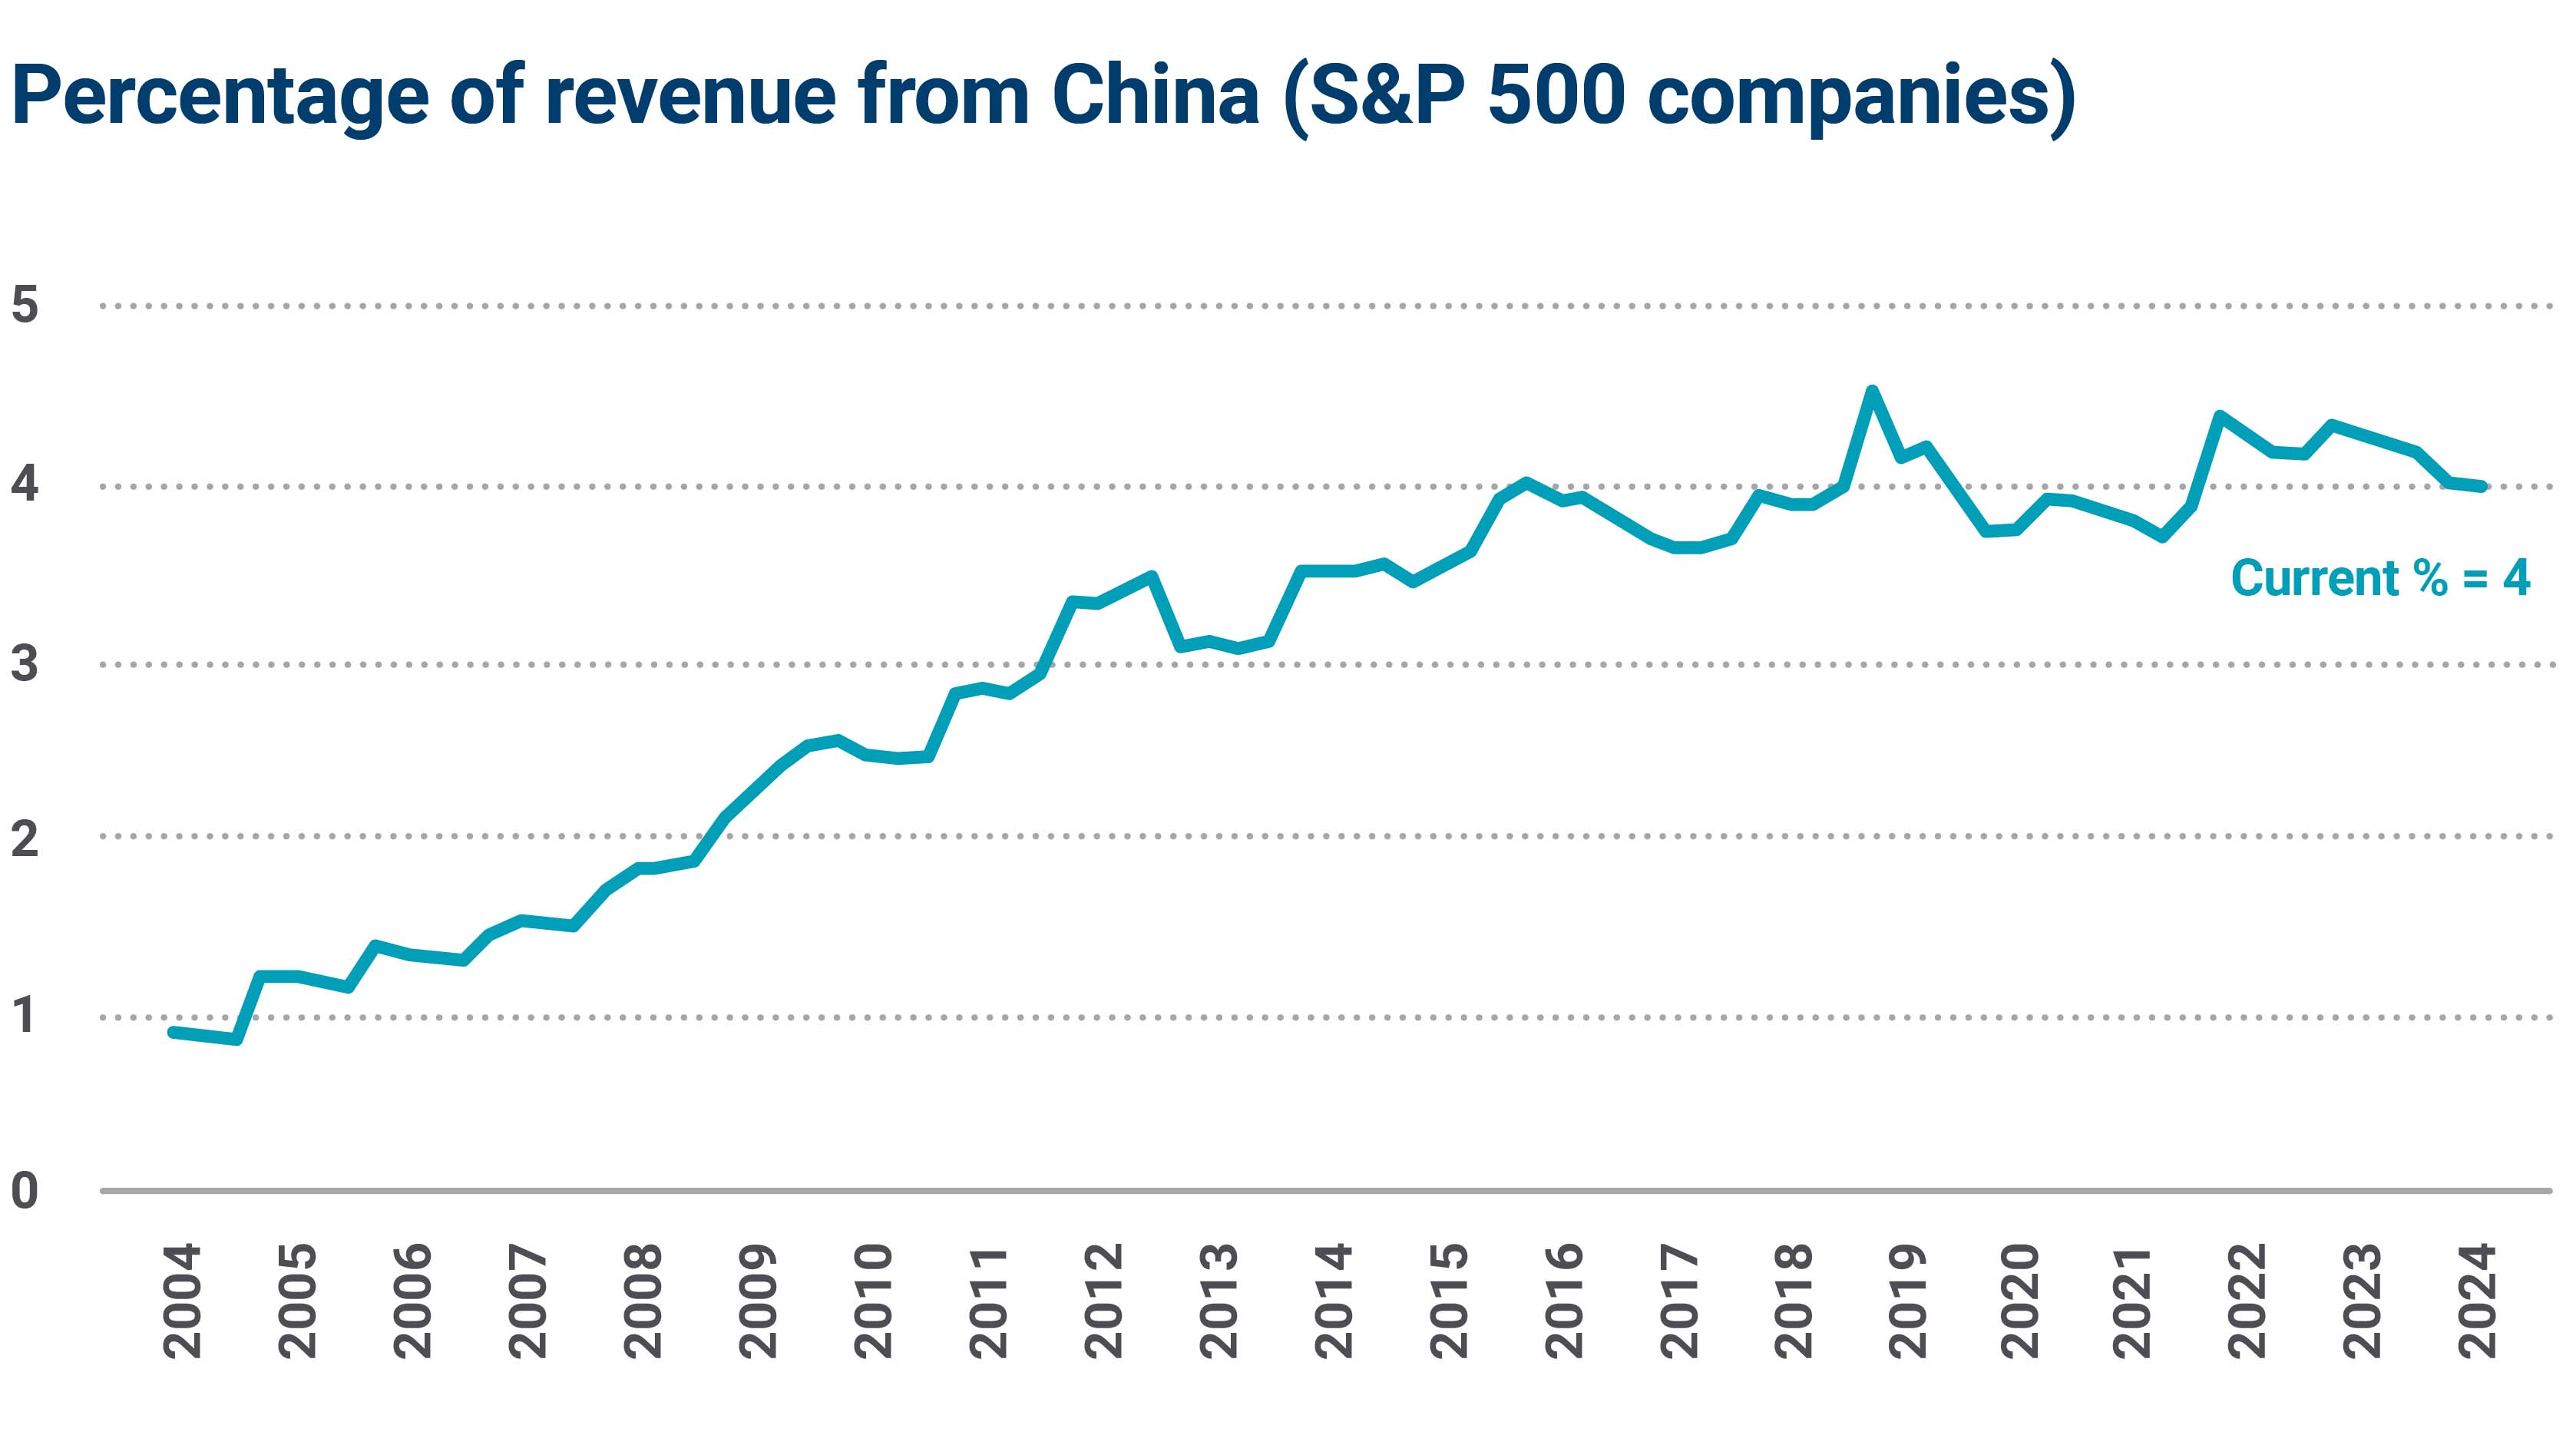
Source: FactSet and American Enterprise Investment Services Inc.
For companies selling abroad, China represents the largest source of foreign revenue, accounting for 13.5% of their international results.
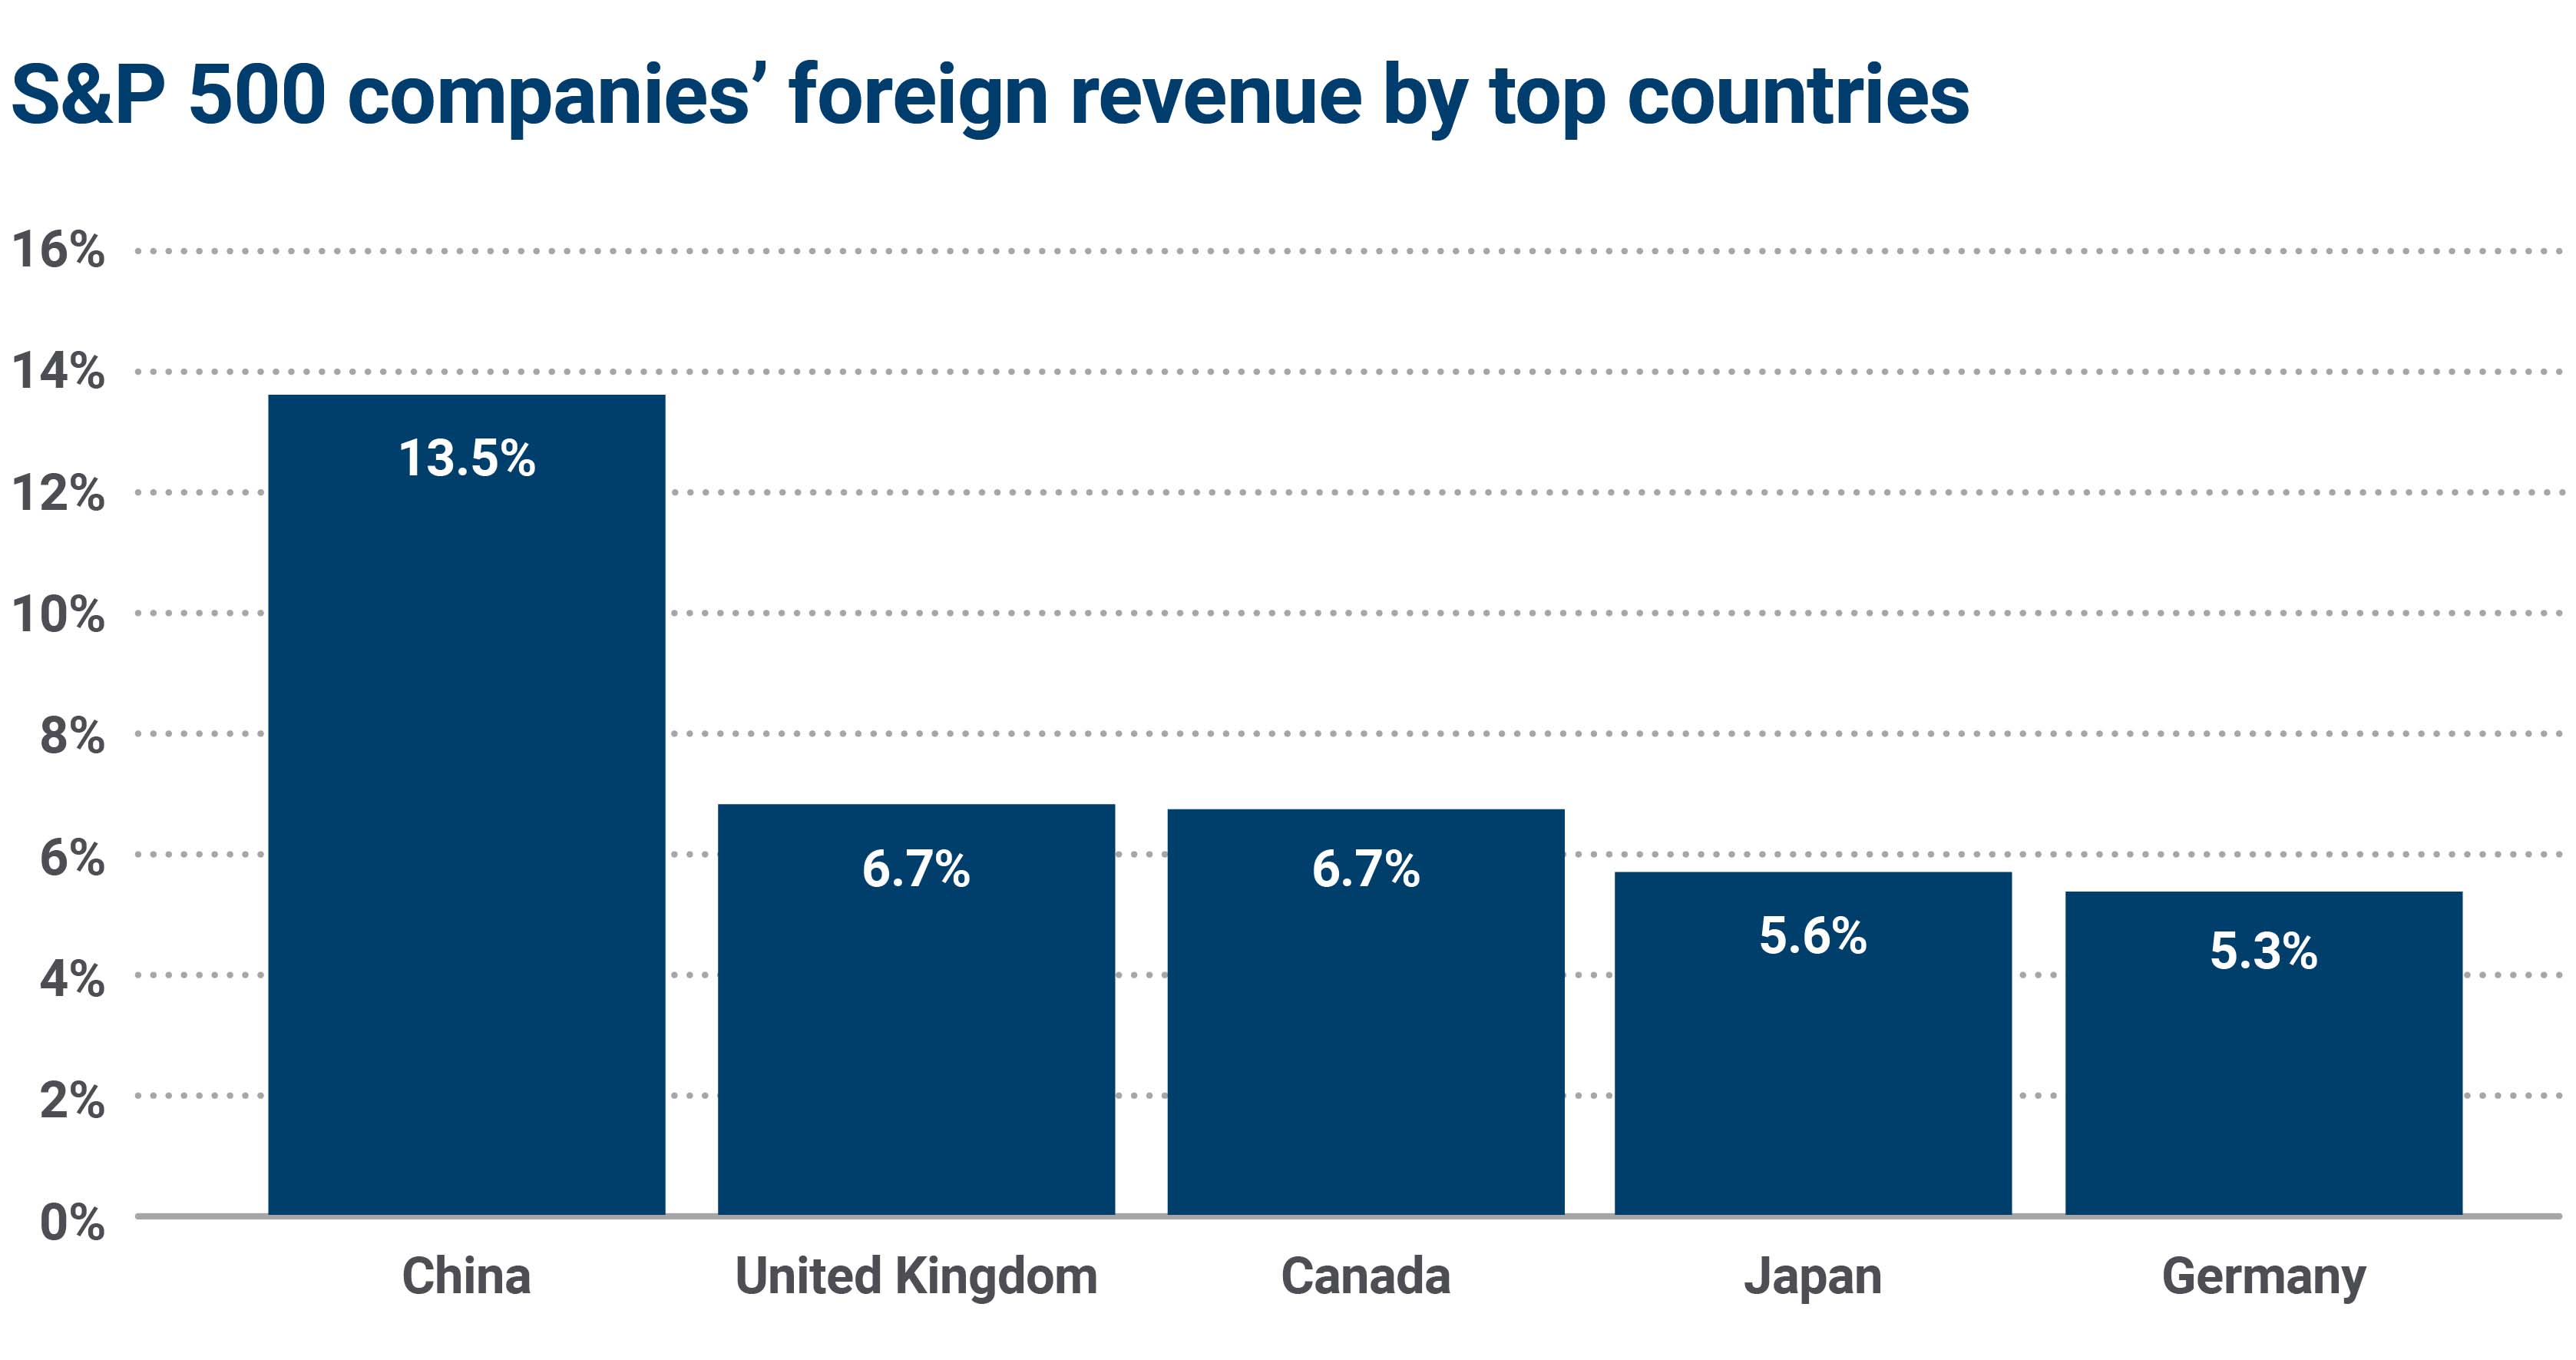
Source: FactSet and American Enterprise Investment Services Inc.
While 4% might seem inconsequential at an aggregate level, an examination by sector or industry shows that certain sectors and industries are more significantly dependent on Chinese revenue streams.
The information technology sector, for instance, derives approximately 13.4% of its revenues from China, a figure that substantially exceeds that of the next largest sector, materials.
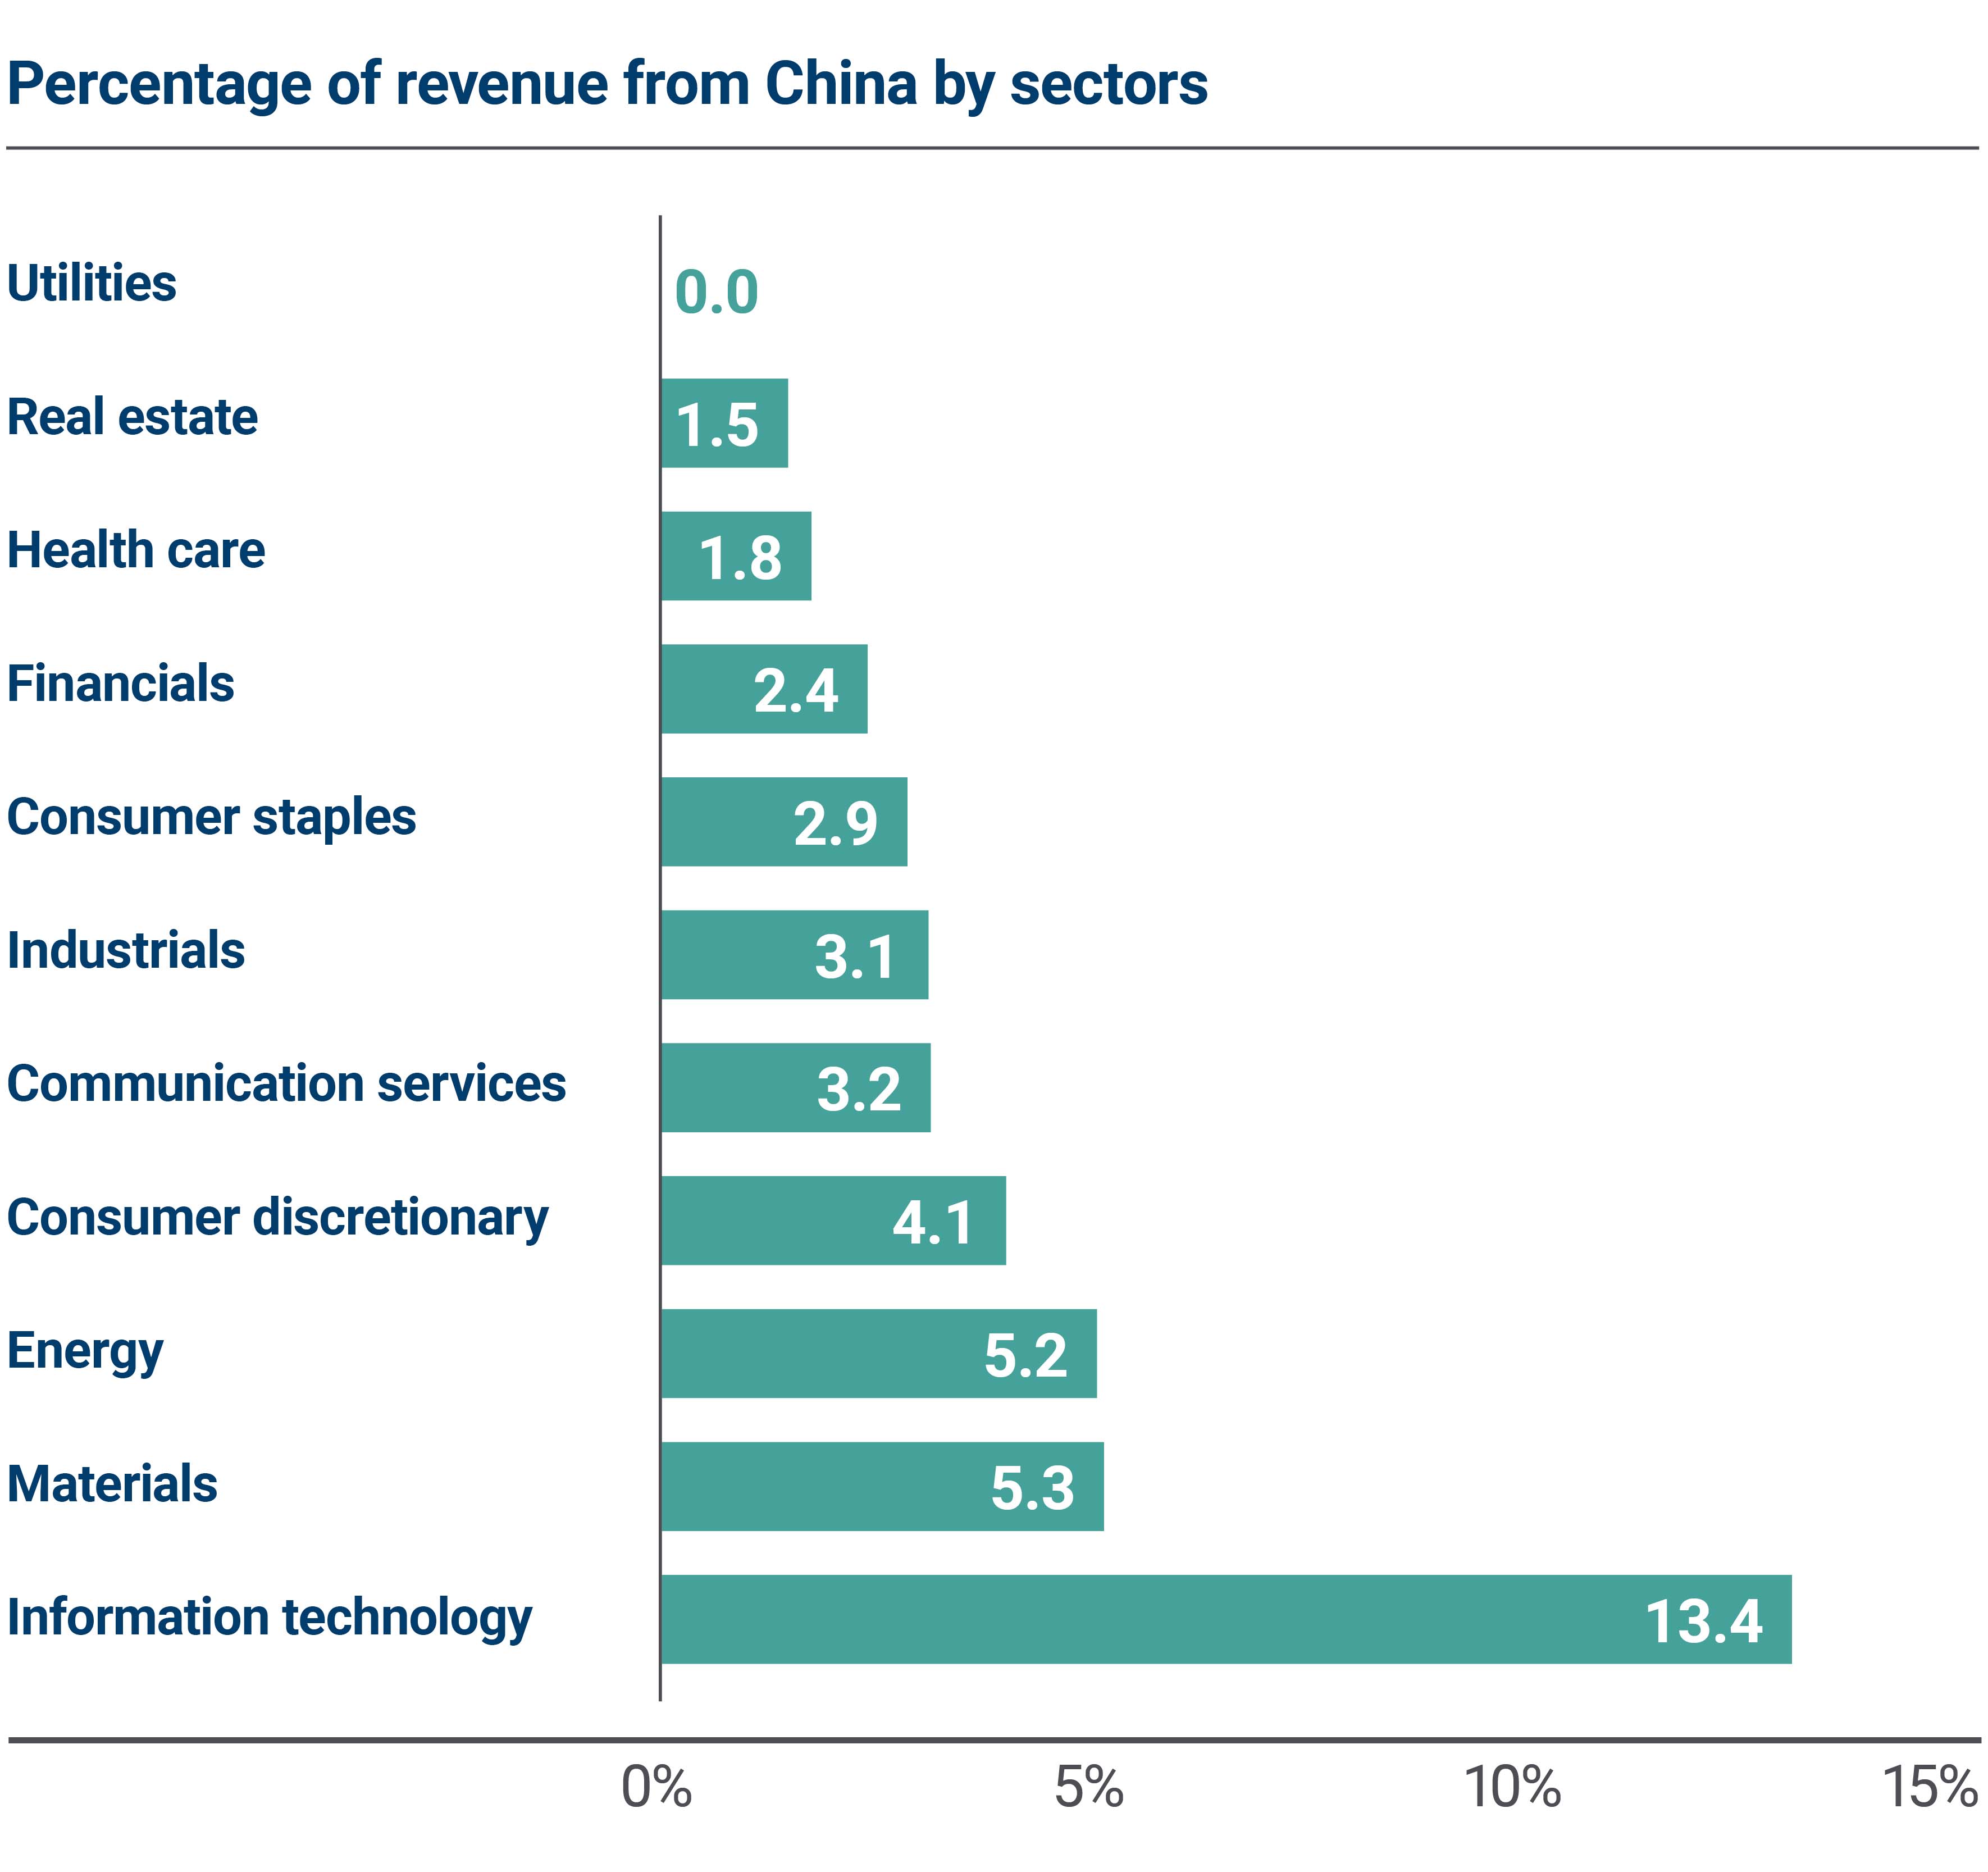
Source: FactSet and American Enterprise Investment Services Inc.
At the industry level, the semiconductor/semiconductor equipment industry reports that more than a quarter of its revenue is sourced from China, closely followed by the automobile components industry at 24%.
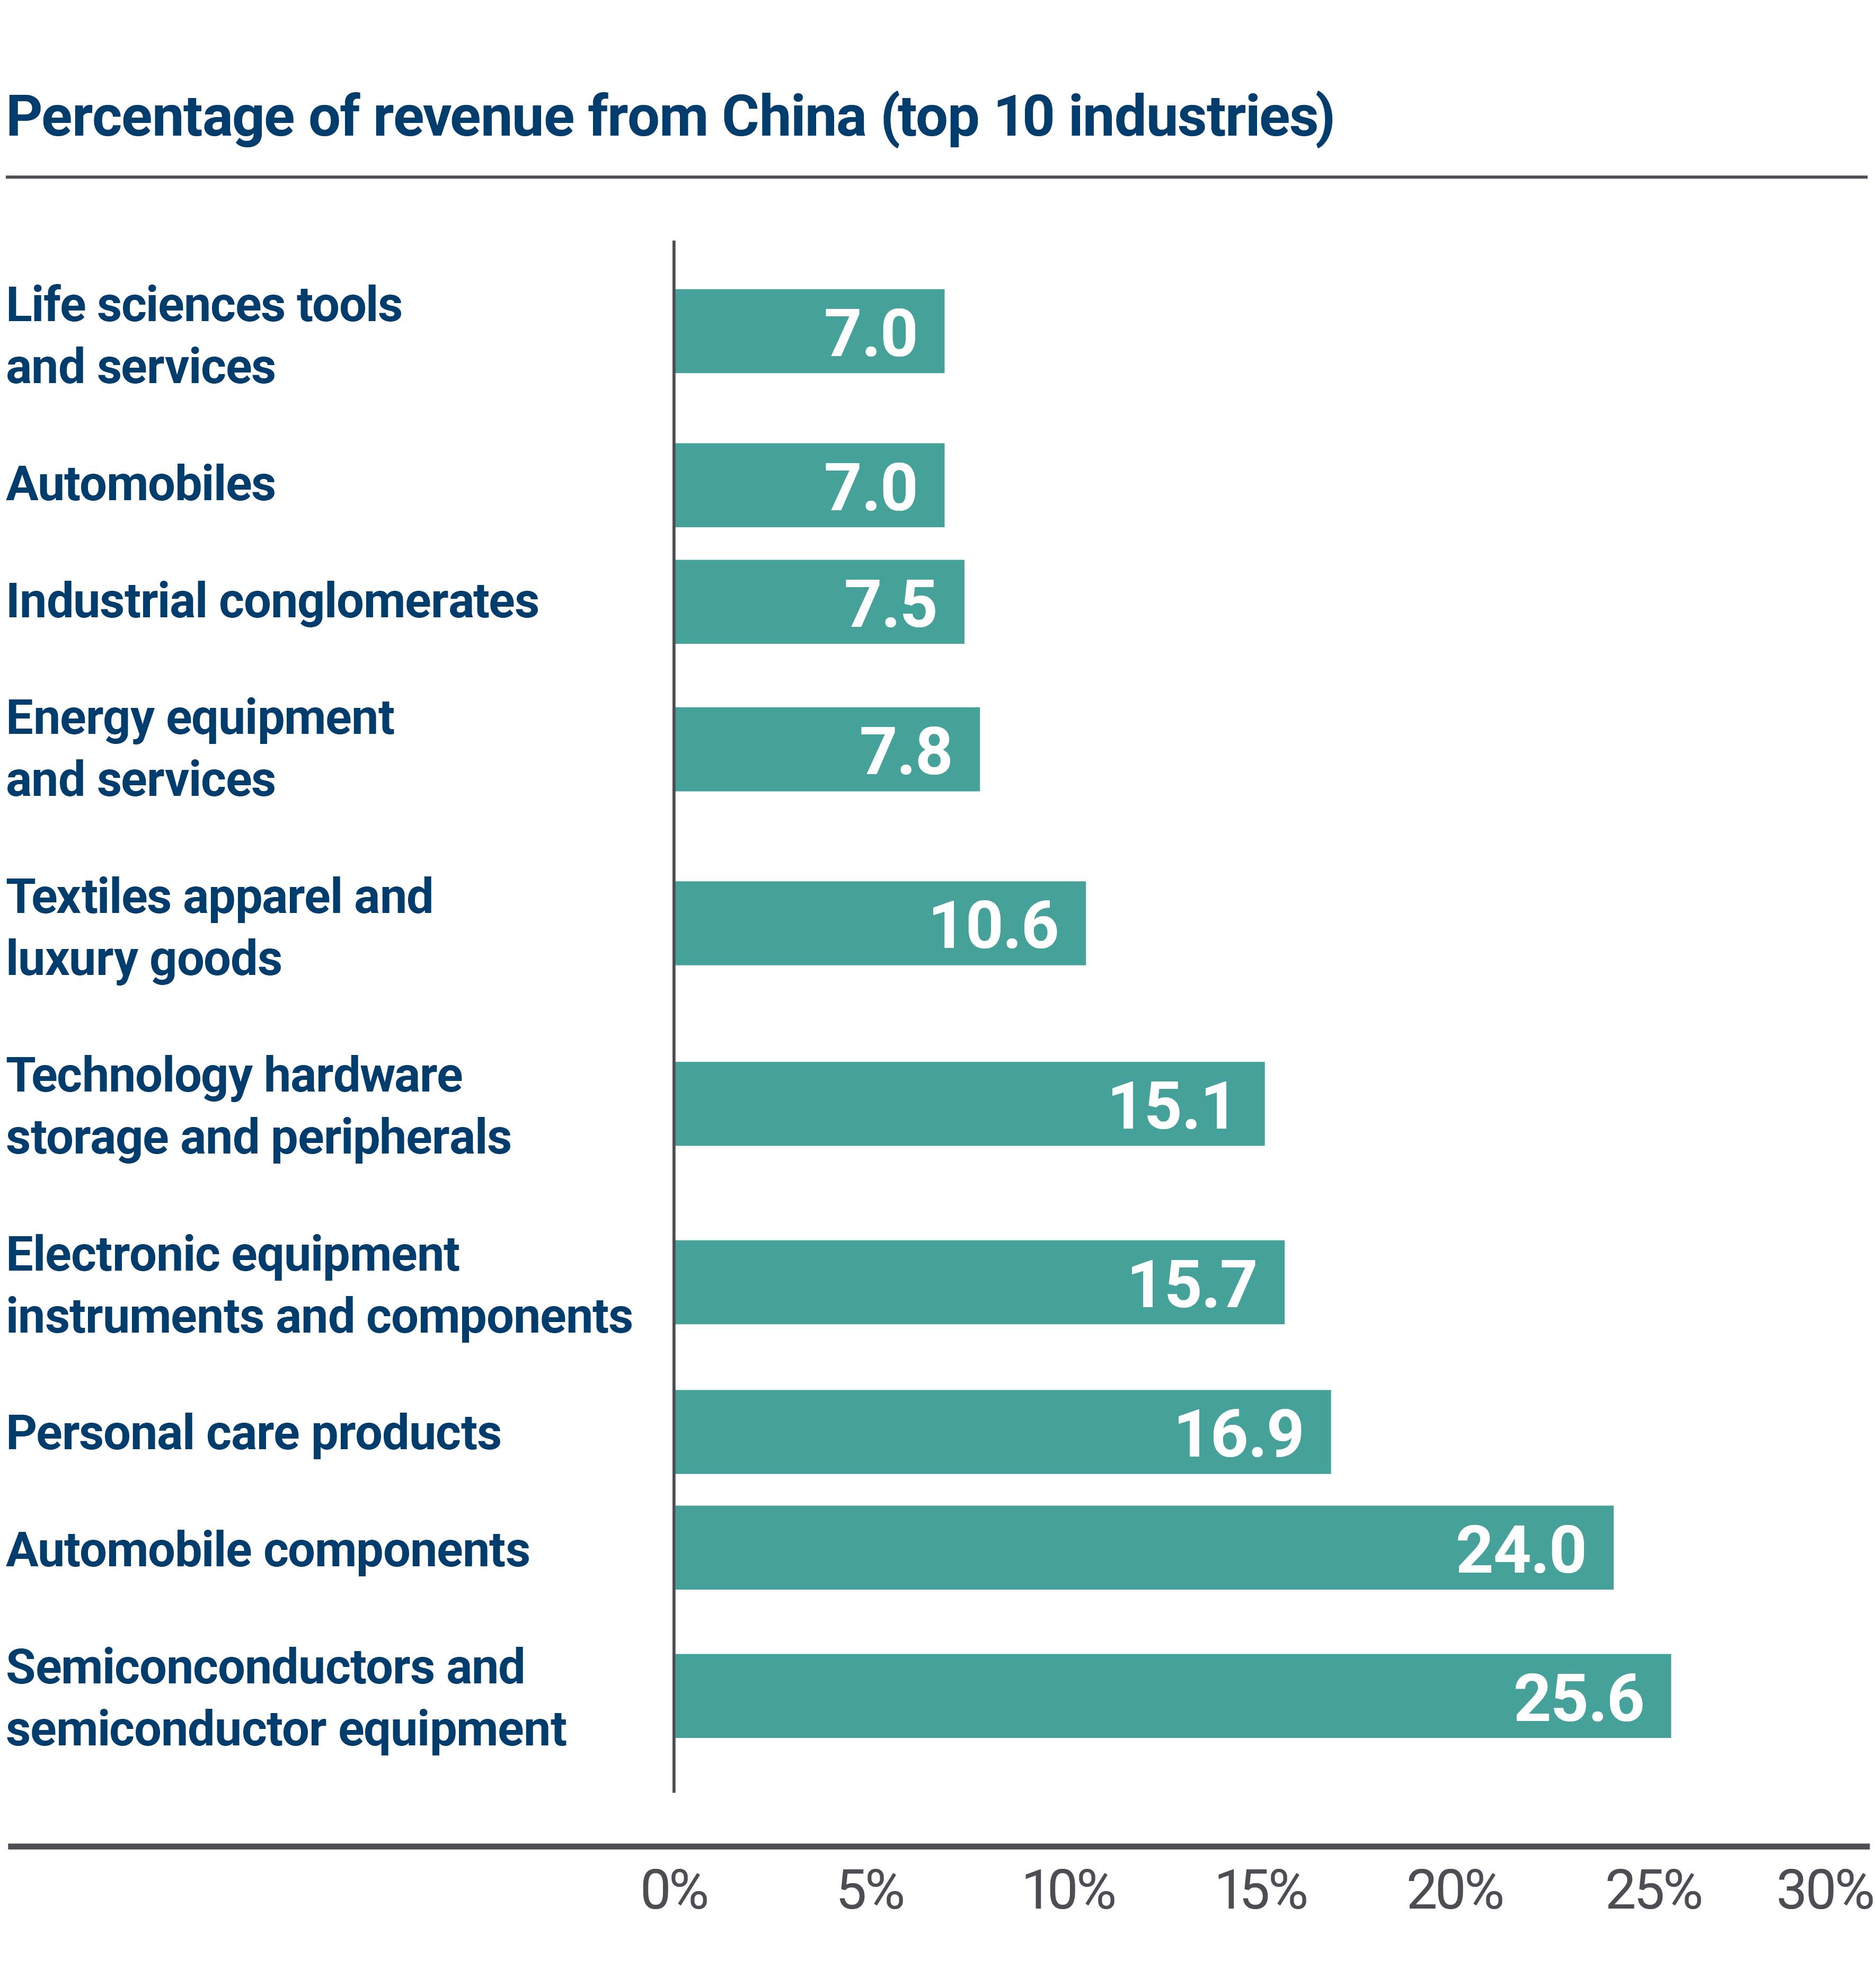
Source: FactSet and American Enterprise Investment Services Inc.
Consequently, these sectors and industries may experience heightened impacts if economic deceleration continues in China.
Potential impact on stock performance
As of the first quarter of 2024, 322 S&P 500 companies reported varying degrees of revenue exposure to China, with some deriving at least 20% of their total sales from the Chinese market.
To understand the influence of this “China Effect” on stock performance, we categorized S&P 500 companies into two groups: those that disclose their sales to or within China and those that do not (accounting rules do not require sales exposures of less than 10% to be disclosed). This categorization aimed to delineate the potential impact, given that nondisclosure often implies negligible or nonexistent exposures.
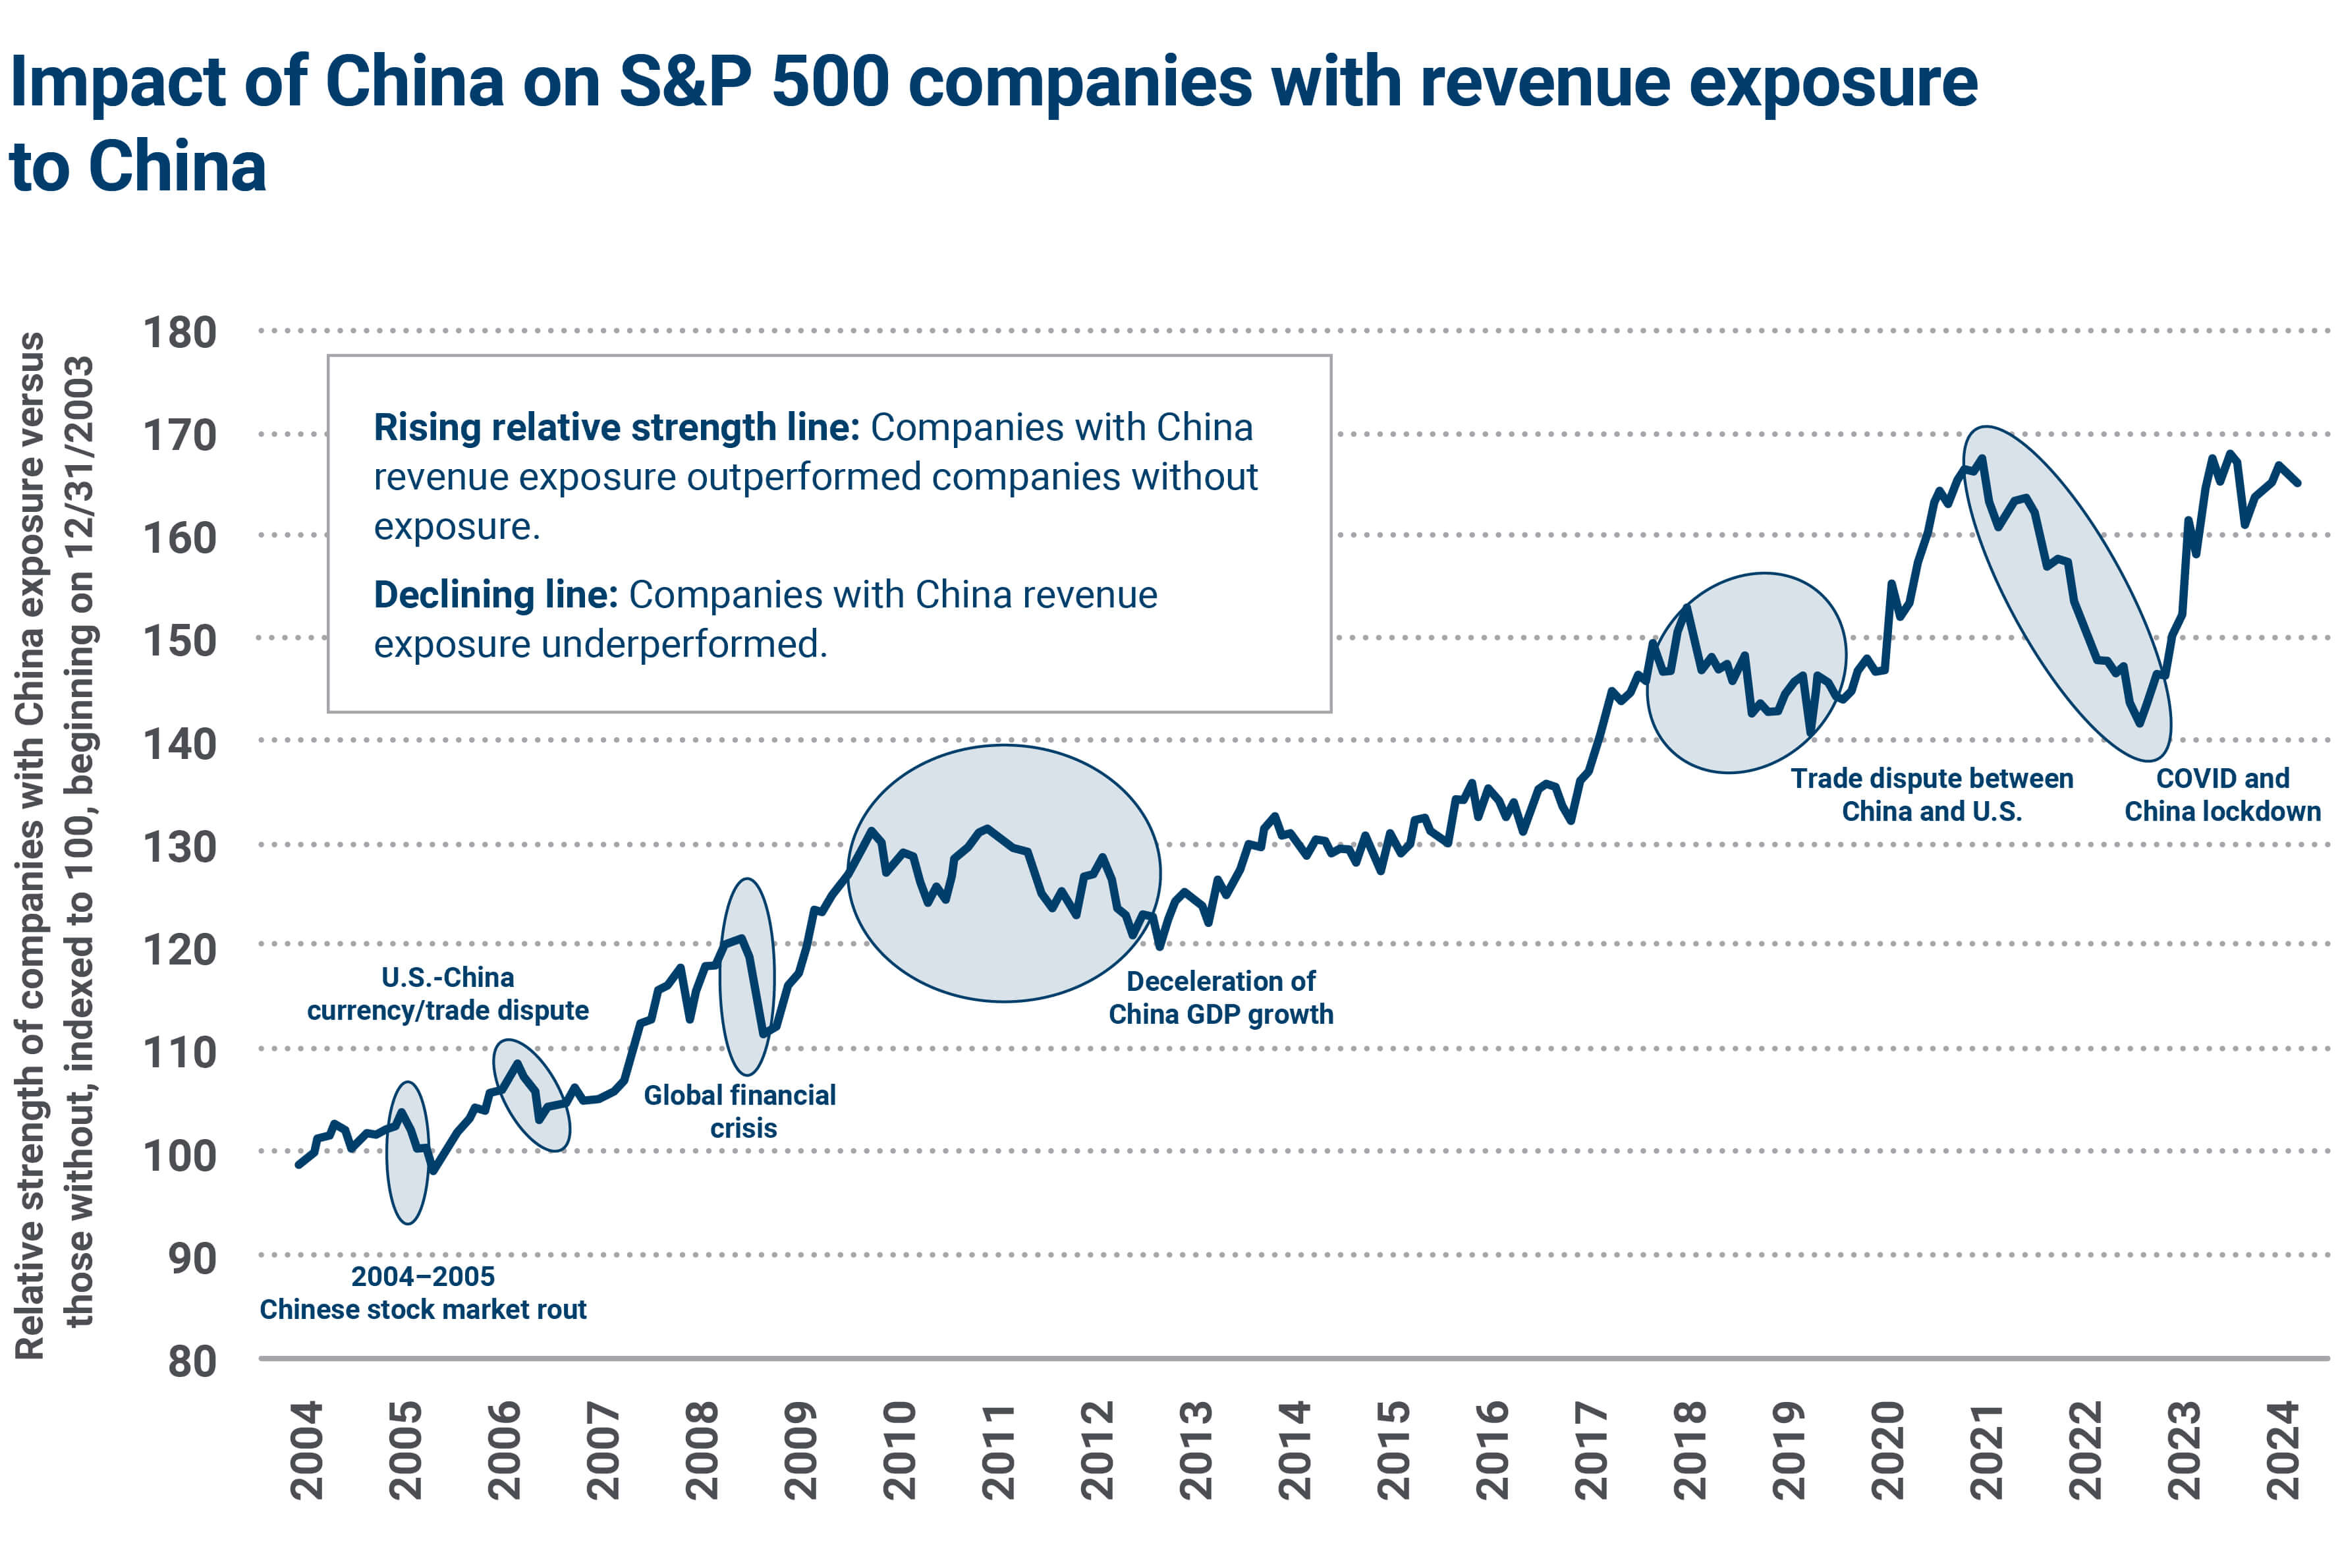
Source: FactSet and American Enterprise Investment Services Inc. Stocks are represented using the S&P 500 Index. The portfolio assumes a monthly rebalance using point-in-time S&P 500 index constituents and real time revenue exposure data. One portfolio invests in S&P 500 stocks that have revenue exposure to China and the other portfolio invests in S&P 500 stocks without revenue exposure to China. The relative performance of the two portfolios is compared by the relative strength line above. An upward moving line indicates the portfolio investing in companies with exposure to China outperformed the other portfolio. A declining line indicates the portfolio investing in companies with exposure to China underperforming the other portfolio. This chart is for illustrative purposes only. Indexes are unmanaged and one cannot directly invest in them. Past performance is not a guarantee of future results.
As the chart above shows, over the past two decades, companies with reported sales to China have consistently outperformed their counterparts without disclosures. This trend underscores the benefits accrued from the "China Dividend" during periods of robust Chinese economic growth. Equally interesting, temporary declines in this relative performance correlate with downturns in either the Chinese economy or its stock market (in the chart above, the declining line in the shaded ovals indicates companies with China revenue exposure underperformed companies without exposure).
While domestic sales continue to dominate the revenue streams for most S&P 500 companies, the presented data underscores the significant influence of the Chinese economy on these entities. Should the economic slowdown in China persist or intensify, certain companies, industries and sectors could be poised to face disproportionately adverse effects.
Reach out to your financial advisor
If you have questions about your investment portfolio’s exposure to the Chinese economy, reach out to your Ameriprise financial advisor.