Despite hard-nosed tariff policies, White House shows willingness to course-correct when necessary
ANTHONY SAGLIMBENE – CHIEF MARKET STRATEGIST, AMERIPRISE FINANCIAL
WEEKLY MARKET PERSPECTIVES — April 14, 2025

Financial markets experienced several bouts of jarring price movements last week, with the CBOE VIX Index climbing above 50 at one point and the S&P 500 Index flirting with a bear market (i.e., a decline of 20% or more from its February peak). The on-again, off-again tariff policy coming out of the White House, as well as unexpected price movements across the bond market, were behind some of the biggest price swings across asset prices in decades. Most economic releases during the week, including updates on consumer inflation, were seen by investors as stale and out-of-date, given evolving tariff dynamics.
The Q1 earnings season swings into gear this week, with thirty-three S&P 500 companies scheduled to report results (including five Dow 30 components). Profit guidance, including results from several key bank and investment firms and large industrial companies reporting over the coming days, will be closely watched for signs of potential stress in their business conditions. On the economic front, updated looks at retail sales, trade, housing, and industrial and manufacturing will be monitored by investors but, again, will likely be less informative for determining where economic conditions are headed.
“In our view, several of President Trump’s trade objectives are noble efforts in restoring trade balance with the U.S. and could be additive to growing the U.S. economy over time. However, the course his administration has chosen to take in trying to achieve those objectives, at least at the moment, has added undue volatility, stress, and uncertainty across financial markets and increased risks to growth.”
Anthony Saglimbene - Chief Market Strategist, Ameriprise Financial

These examples are shown for illustrative purposes only and are not guaranteed. An index is a statistical composite that is not managed. It is not possible to invest directly in an index. Past performance is not a guarantee of future results.
Last week in review:
-
Whether by design or driven by a White House reassessment in response to severe dislocations in the bond market last week, President Trump, after letting all “outsized” reciprocal tariffs on key trading partners go into effect, quickly reversed course and announced a 90-day pause. However, a 10% universal tariff rate on imports to the U.S. is now in effect for all countries, as are previously announced tariffs on steel, aluminum, and autos. Yet, Chinese imports into the U.S. currently face a staggering 145% tariff rate, while U.S. imports to China face a steep 125% duty. Bottom line: Investors should assume the two largest economies in the world are now locked in an all-out trade war, and the flow of certain goods between each country could grind to a halt if these levies remain in place for any extended period. Notably, the average tariff rate in the U.S. has quickly climbed to above 20% from 2.5% last year, with most of the trade aggression now firmly centered on China.
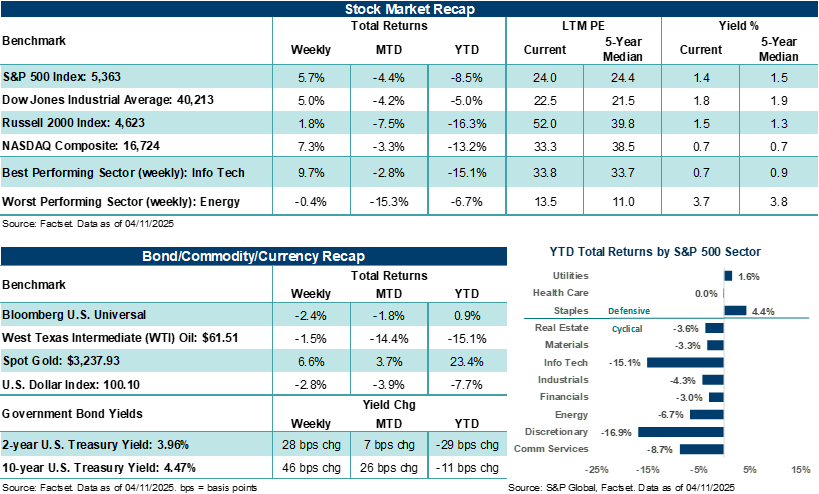
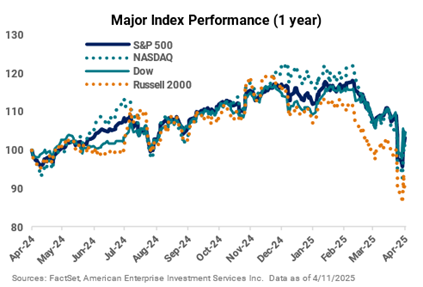
- The S&P 500 Index finished the week higher by +5.7%. But on Tuesday, the Index had closed roughly 19% off its February high, with the broadest measure of U.S. stocks flirting with a bear market, which, in several cases, has preceded a recession. However, in response to Trump’s tariff reversal on Wednesday, the S&P 500 climbed +9.5%, posting its third-best day ever and the largest gain since October 2008.
- The NASDAQ Composite ended the week higher by +7.3% after posting its second-best day on record on Wednesday. Though Big Tech helped fuel gains on the week, most benchmark heavyweights remain lower for the year.
- The Dow Jones Industrials Average (+5.0%) and Russell 2000 Index (+1.8%) also rebounded and moved higher.
- Whether driven by derivative dislocations, a poor auction, global investors stepping away from exposure, China retaliation, or some combination of each, U.S. Treasury prices experienced extreme volatility last week. As a result, developments in the Treasury market sent a strong warning signal to the White House that the tariff uncertainty it continues to sow is beginning to disrupt the long-entrenched view that Treasuries are the preferred asset of exposure during periods of financial stress. Long-dated U.S. Treasury yields, including the 10-year and 30-year, climbed over 40 basis points.
- The U.S. Dollar Index posted its worst week since November 2022, Gold notched its best week since March 2020, and West Texas Intermediate (WTI) crude fell, adding to its 10% decline the prior week.
- Q1 earnings season started with mixed results. Delta Airlines surpassed analyst profit estimates but pulled 2025 guidance due to the uncertain environment. Initial bank earnings on Friday surpassed analyst estimates, as interest rates, trading volume, and stable lending trends were additive to results. However, color on the economic outlook, merger and acquisition activity (which has not materialized), and market volatility weighed on the outlook.
- On the economic front, the March Consumer Price Index (CPI) declined more than expected, with the annualized core measure falling below +3.0% for the first time since April 2021. The March Producer Price Index (PPI) recorded its biggest headline drop since October 2023, driven by lower energy prices. However, the PPI update is somewhat stale, given the expected higher input costs due to tariffs in the months ahead. A preliminary look at April Michigan consumer sentiment fell to its lowest levels since June 2022, and one year ahead inflation expectations rose to their highest level since 1981. In the latest survey of small business owners, respondents dialed back sales growth expectations amid White House policy uncertainty. Finally, Congress passed a budget blueprint, unlocking the next step in the reconciliation process, which is to begin drafting legislation that could raise the debt ceiling and extend the tax cuts made in 2017, along with other key Republican priorities.
Despite hardnosed tariff policies, President Trump remains willing to course-correct when necessary.
Unfortunately, the Trump administration’s recent policy efforts to reshape global trade, invigorate U.S. manufacturing, and create a more level playing field for U.S. companies abroad, in our view, has increased the risk of a global economic slowdown over the near term.
This degree of unexpected tax on consumption, business investment, and global trade was not in our forecasts for this year, nor was it in most market participants’ expectations for 2025. Thus, U.S. corporate profit growth expectations over the coming quarters are less likely to be achieved if consumer or business spending stalls, unemployment rises, and confidence about the future erodes more than it already has. However, if trade deals are struck sooner rather than later with our closest allies (e.g., Canada, Mexico, and the European Union) and help bring down bilateral trade barriers, we believe the negative effects on growth this year could be less extreme than what investors currently fear. In this instance, stock prices may have an opportunity to move higher over time, particularly if a recession is avoided.
That said, the current state of U.S./China trade relations, or the lack thereof at this point, is a material threat to global growth if circumstances between the two economic superpowers don’t begin to improve over the coming weeks and months. The world’s two largest economies are not only intertwined with each other but are woven into the fabric of trade and finance across the globe. Understating last week’s escalating tariff friction between the U.S. and China, which will essentially halt the exchange of certain goods between the two countries and hurt U.S. businesses, large and small, would be a material mistake, in our view. This dynamic alone has the potential to disrupt global trade in 2025 if the current tariff policy between the two countries isn’t softened.
Yet, we do not believe that President Trump or his administration officials are putting forth trade policies that ignore the potential risks they could cause to the U.S. economy, financial markets, and consumers and businesses. Importantly, Trump has shown he can and will course-correct policy if financial conditions deteriorate suddenly, as he did last week, offering a 90-day reciprocal tariff reprieve for most countries. And late Friday, President Trump excluded smartphones, computers, and other technology devices and components from reciprocal tariffs, including products and parts that come from China. This one move removes extreme tariffs on a large portion of imports coming to the U.S. from China. According to the U.S. Census Bureau, the exempted products accounted for roughly $100 billion in U.S. imports from China in 2024, or 23% of total imports from the second largest economy in the world. In our view, this should provide temporary relief for Apple as well as other companies that make technological products and components in China, which have seen their stocks suffer over recent weeks. That said, the White House has stated a separate tariff structure is expected for key tech, semiconductors, and pharmaceuticals in the near future, which means any relief may be short-lived and/or contingent on the next White House tariff announcement.
Bottom line: In our view, several of President Trump’s trade objectives are noble efforts in restoring trade balance with the U.S. and could be additive to growing the U.S. economy over time. However, the course his administration has chosen to take in trying to achieve those objectives, at least at the moment, has added undue volatility, stress, and uncertainty across financial markets and increased risks to growth. At the same time, the President has shown that he is willing to adjust (when necessary), is looking to negotiate better trade deals for the U.S. and appears willing to listen to outside counsel for input on policy. These factors can quickly change the market’s interpretation of tariff dynamics and, thus, stock momentum, as investors saw first-hand last week.
As such, we would advise investors to avoid making hard and fast assumptions about how tariff developments will ultimately play out in the economy and on corporate profits. Let alone the ultimate impact on portfolios, which include assets like stocks that are attempting to discount what the environment looks like 6-9 months into the future. Instead, we suggest investors prepare for a range of possible intermediate-term outcomes that include slow-to-positive economic and profit growth (which could see stocks rebound from current levels) and scenarios of slow-to-negative growth (where stocks could move lower or stall near current levels). Either way, we believe a well-diversified portfolio of high-quality assets is built to weather environments like this and can put investors in a position of strength once the fog of uncertainty lifts.
The week ahead:
The start of the Q1 earnings season will provide investors with critical “on-the-ground” information on consumer and business trends and provide color on how each is responding to evolving conditions. Economic releases here at home and central bank rate decisions abroad also line the week before U.S. markets close for Good Friday.
- Goldman Sachs, Bank of America, Citigroup, J.B. Hunt Transport Services, Johnson & Johnson, CSX, United Airlines, and Netflix are some of the key companies reporting profit results this week. With 6% of S&P 500 first quarter reports complete, blended earnings per share (EPS) growth is higher by +7.3% year-over-year on revenue growth of +4.3%. According to FactSet, the Index is expected to post its seventh straight quarter of earnings growth. Analysts currently expect second quarter S&P 500 EPS to grow by over +8.0%. In our view, the rubber likely hits the road this earnings season when it comes to corporate outlooks. Companies that can provide visibility into their business trends and reaffirm outlooks could see their stock prices stabilize or possibly move higher. Companies that pull or lower guidance could see more volatility this earnings season in light of soft investor confidence.
- March retail sales could see a jump based on consumers’ front-running tariffs, though lower gasoline prices could be a headwind for the headline figure. Housing data, industrial production, export and import data, and several speeches from Federal Reserve officials should keep investors busy.
- The European Central Bank will deliver an updated policy statement and rate decision on Thursday, while the Bank of Canada delivers its policy update on Wednesday. Standing pat or cutting rates will likely come down to a close call from each.