Bulls vs. bears: Which will prevail?
Anthony Saglimbene, Chief Market Strategist – Ameriprise Financial
April 21, 2025

No doubt, the first few months of 2025 have been tough for investors to swallow. Major U.S. stock indexes closed out the first quarter meaningfully lower, countering investor expectations that stocks would keep gravitating higher following two strong years of returns.
However, tariff uncertainty has put an unexpected stranglehold on markets this year, as recession odds have increased, and global trade frictions rise.
Although several major areas of the market have corrected from their recent highs and outlooks for the year have become more guarded, we believe maintaining a balanced perspective of current conditions is critical during periods of market stress.
Here are the bull and bear cases for stocks moving forward as we currently see them.
The bullish case for stocks
-
The stock market decline feels worse than it really is. Notably, corrections of 10% or more happen more frequently than investors typically remember. If a recession is avoided based on recent tariff dynamics, current stock levels may offer attractive entry points for investors willing to dollar-cost average into the volatility.
-
The U.S. economy and S&P 500 Index corporate profits are still expected to grow. It is very difficult to forecast where the economy and corporate profits could head over the near-to-intermediate term due to current tariff policies. However, the U.S. economy and corporate earnings are expected to remain positive in the first half of the year. Importantly, corporate profit margins sit at very healthy levels relative to history, which could help companies navigate tariff uncertainty and stabilize demand and profits, particularly if tariff impacts are temporary.
-
Investors may be overly sour on the market outlook over the coming months, which offers a contrarian signal, in our view. Investors are as bearish on future stock returns today as they typically are during much larger drawdown periods. Consumers in The Conference Board’s monthly survey report a dire stock outlook. In addition, U.S. Economic Policy Uncertainty Index recently spiked to levels last seen during COVID-19. On average, when sentiment is this weak and uncertainty about policy is this high, some clarity eventually forms. As a result, stock performance tends to improve over the next 6 to 12 months.
-
Finally, seasonality trends could improve, as April through July collectively is historically a solid stretch for stock prices over the last 20 years. In addition, rapid drops of +10.0% or more, accompanied by oversold technical conditions over the near term (without a recession), tend to be solid longer-term buying opportunities.
Bottom line: Stock corrections are a healthy and necessary function in the market that allows bull markets to continue.
The bearish case for stocks
-
Tariff uncertainty is a meaningful threat to our outlook and could lower our assessment of growth/profits over the coming quarters. Stock prices could see further selling pressure if the cumulative threat of tariff announcements becomes an entrenched reality and begins to sap CEO confidence, raise inflation, lower employment and generally slow U.S./global economic conditions.
We believe tariff announcements, as presented thus far, could lower U.S. GDP growth meaningfully, depending on how conditions evolve. Stock prices would likely struggle to gain traction in this environment, but how much more than what has already been discounted in current stock prices is up for debate.
-
Stock corrections, at times, can be jarring and risk turning into bear markets. According to Bespoke Investment Group, the average S&P 500 Index correction since 1952 has produced a peak-to-trough drop of 18.2% and a median drop of 15.7%. In April, the S&P 500 was down by as much as 19% from its recent peak at one point. Some major U.S. stock averages are already in bear markets. If the S&P 500 falls into a bear market, it may be a sign of more stress on growth and profits ahead.
-
Technical conditions remain weak. The S&P 500 is trading below its longer-term trend line and has failed to reclaim the average. Without a meaningful catalyst, stocks may find it hard to break out of their downtrend, which would likely limit upside potential over the near term.
-
Stocks aren’t cheap, and visibility into earnings estimates are low. The S&P 500 currently trades at roughly 20 times this year’s earnings, which is still elevated based on longer-term averages. In addition, there is less conviction in the earnings estimates driving the current price-to-earnings multiple and in light of evolving tariff policies.
Bottom line: Recent stock declines have reset expectations and done a fair bit to temper elevated valuations. However, stock prices could see further pressure if earnings estimates fall more aggressively in the coming weeks and months and if economic conditions worsen.
Learn more: Magnificent 7: Too much of a good thing?
Which direction may prevail in Q2?
Unfortunately, the second quarter may bring with it as much uncertainty and volatility for investors as the first quarter of the year. While we believe the bullish case for stocks may prevail longer-term given current firm U.S. economic and profit conditions, the threat of Trump administration tariff policies and possible retaliatory tariffs from other countries could quickly alter our outlook.
Nevertheless, that point should not cause one to deviate from a well-diversified portfolio. In our view, investors should focus on holding high-quality assets across their portfolio, ensure their allocations match their risk tolerance, and take a longer-term view of the current market stress, which, historically, can create opportunities to dollar-cost average into high-quality assets over time.
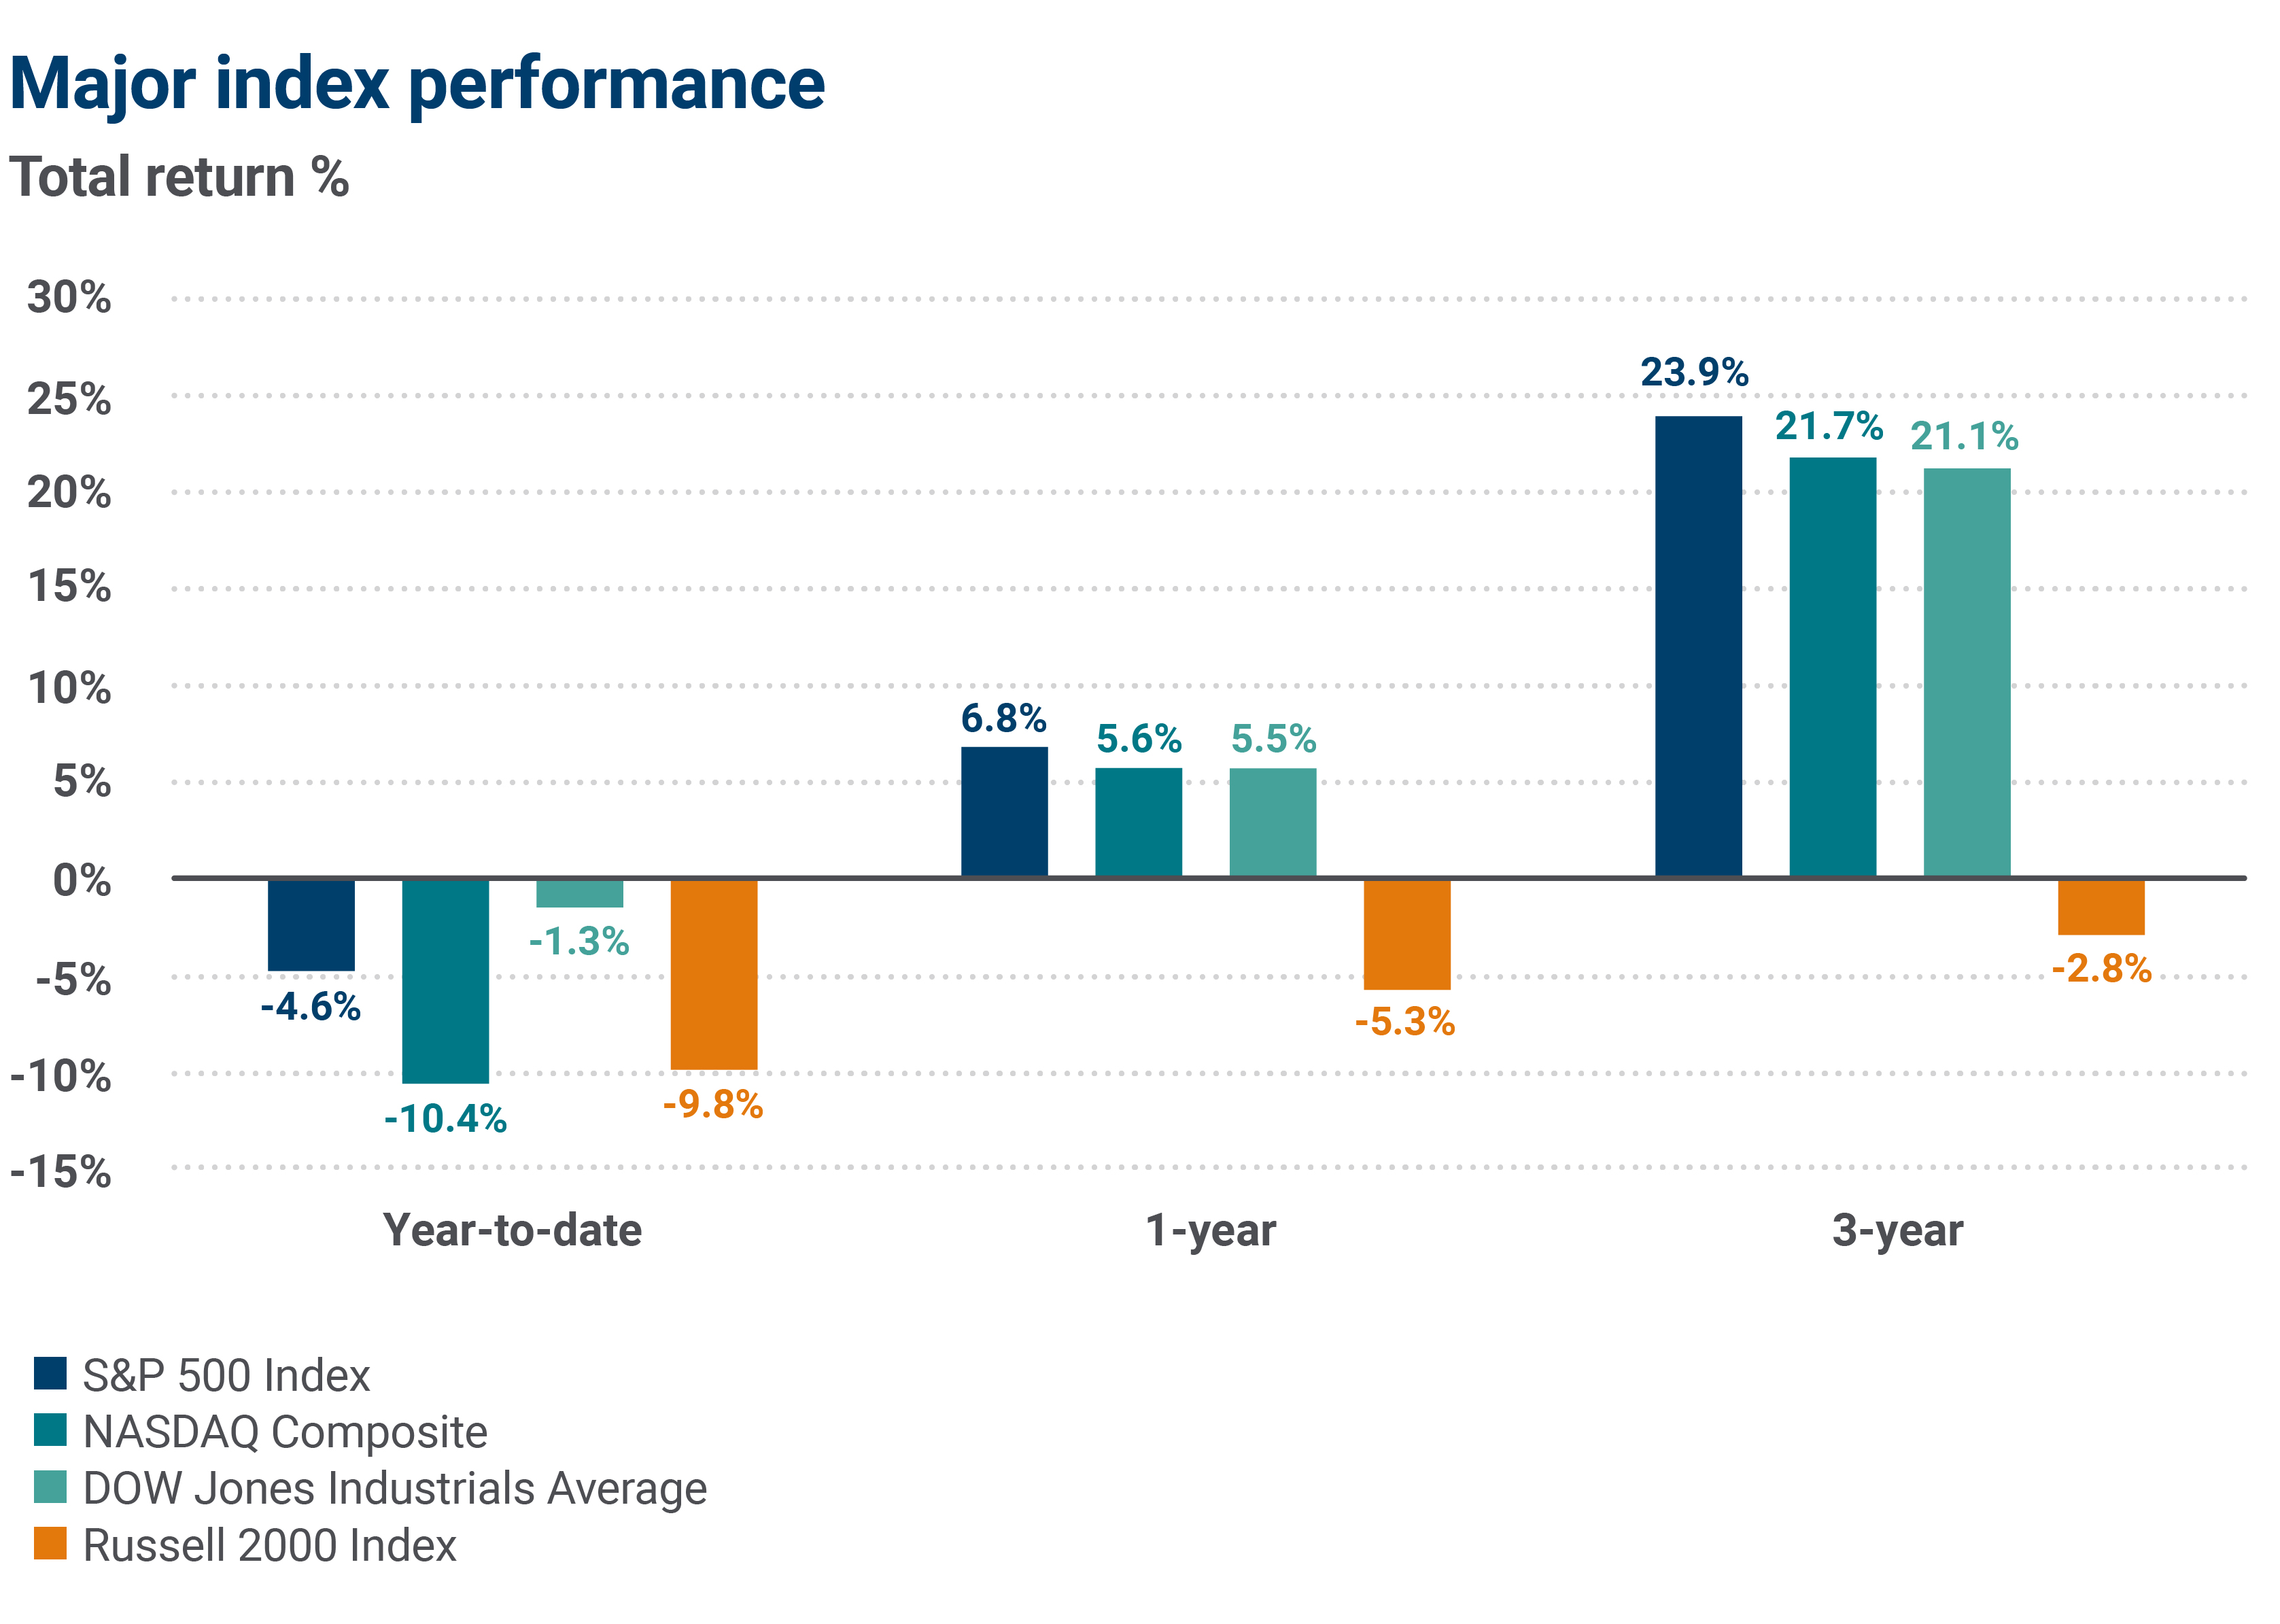
Sources: FactSet, American Enteriprise Investment Services, Inc. Data as of 3/31/2025. These figures are shown for illustrative purposes only and are not guaranteed. An index is a statistical composite that is not managed. It is not possible to invest directly in an index. Past performance is not a guarantee of future results.
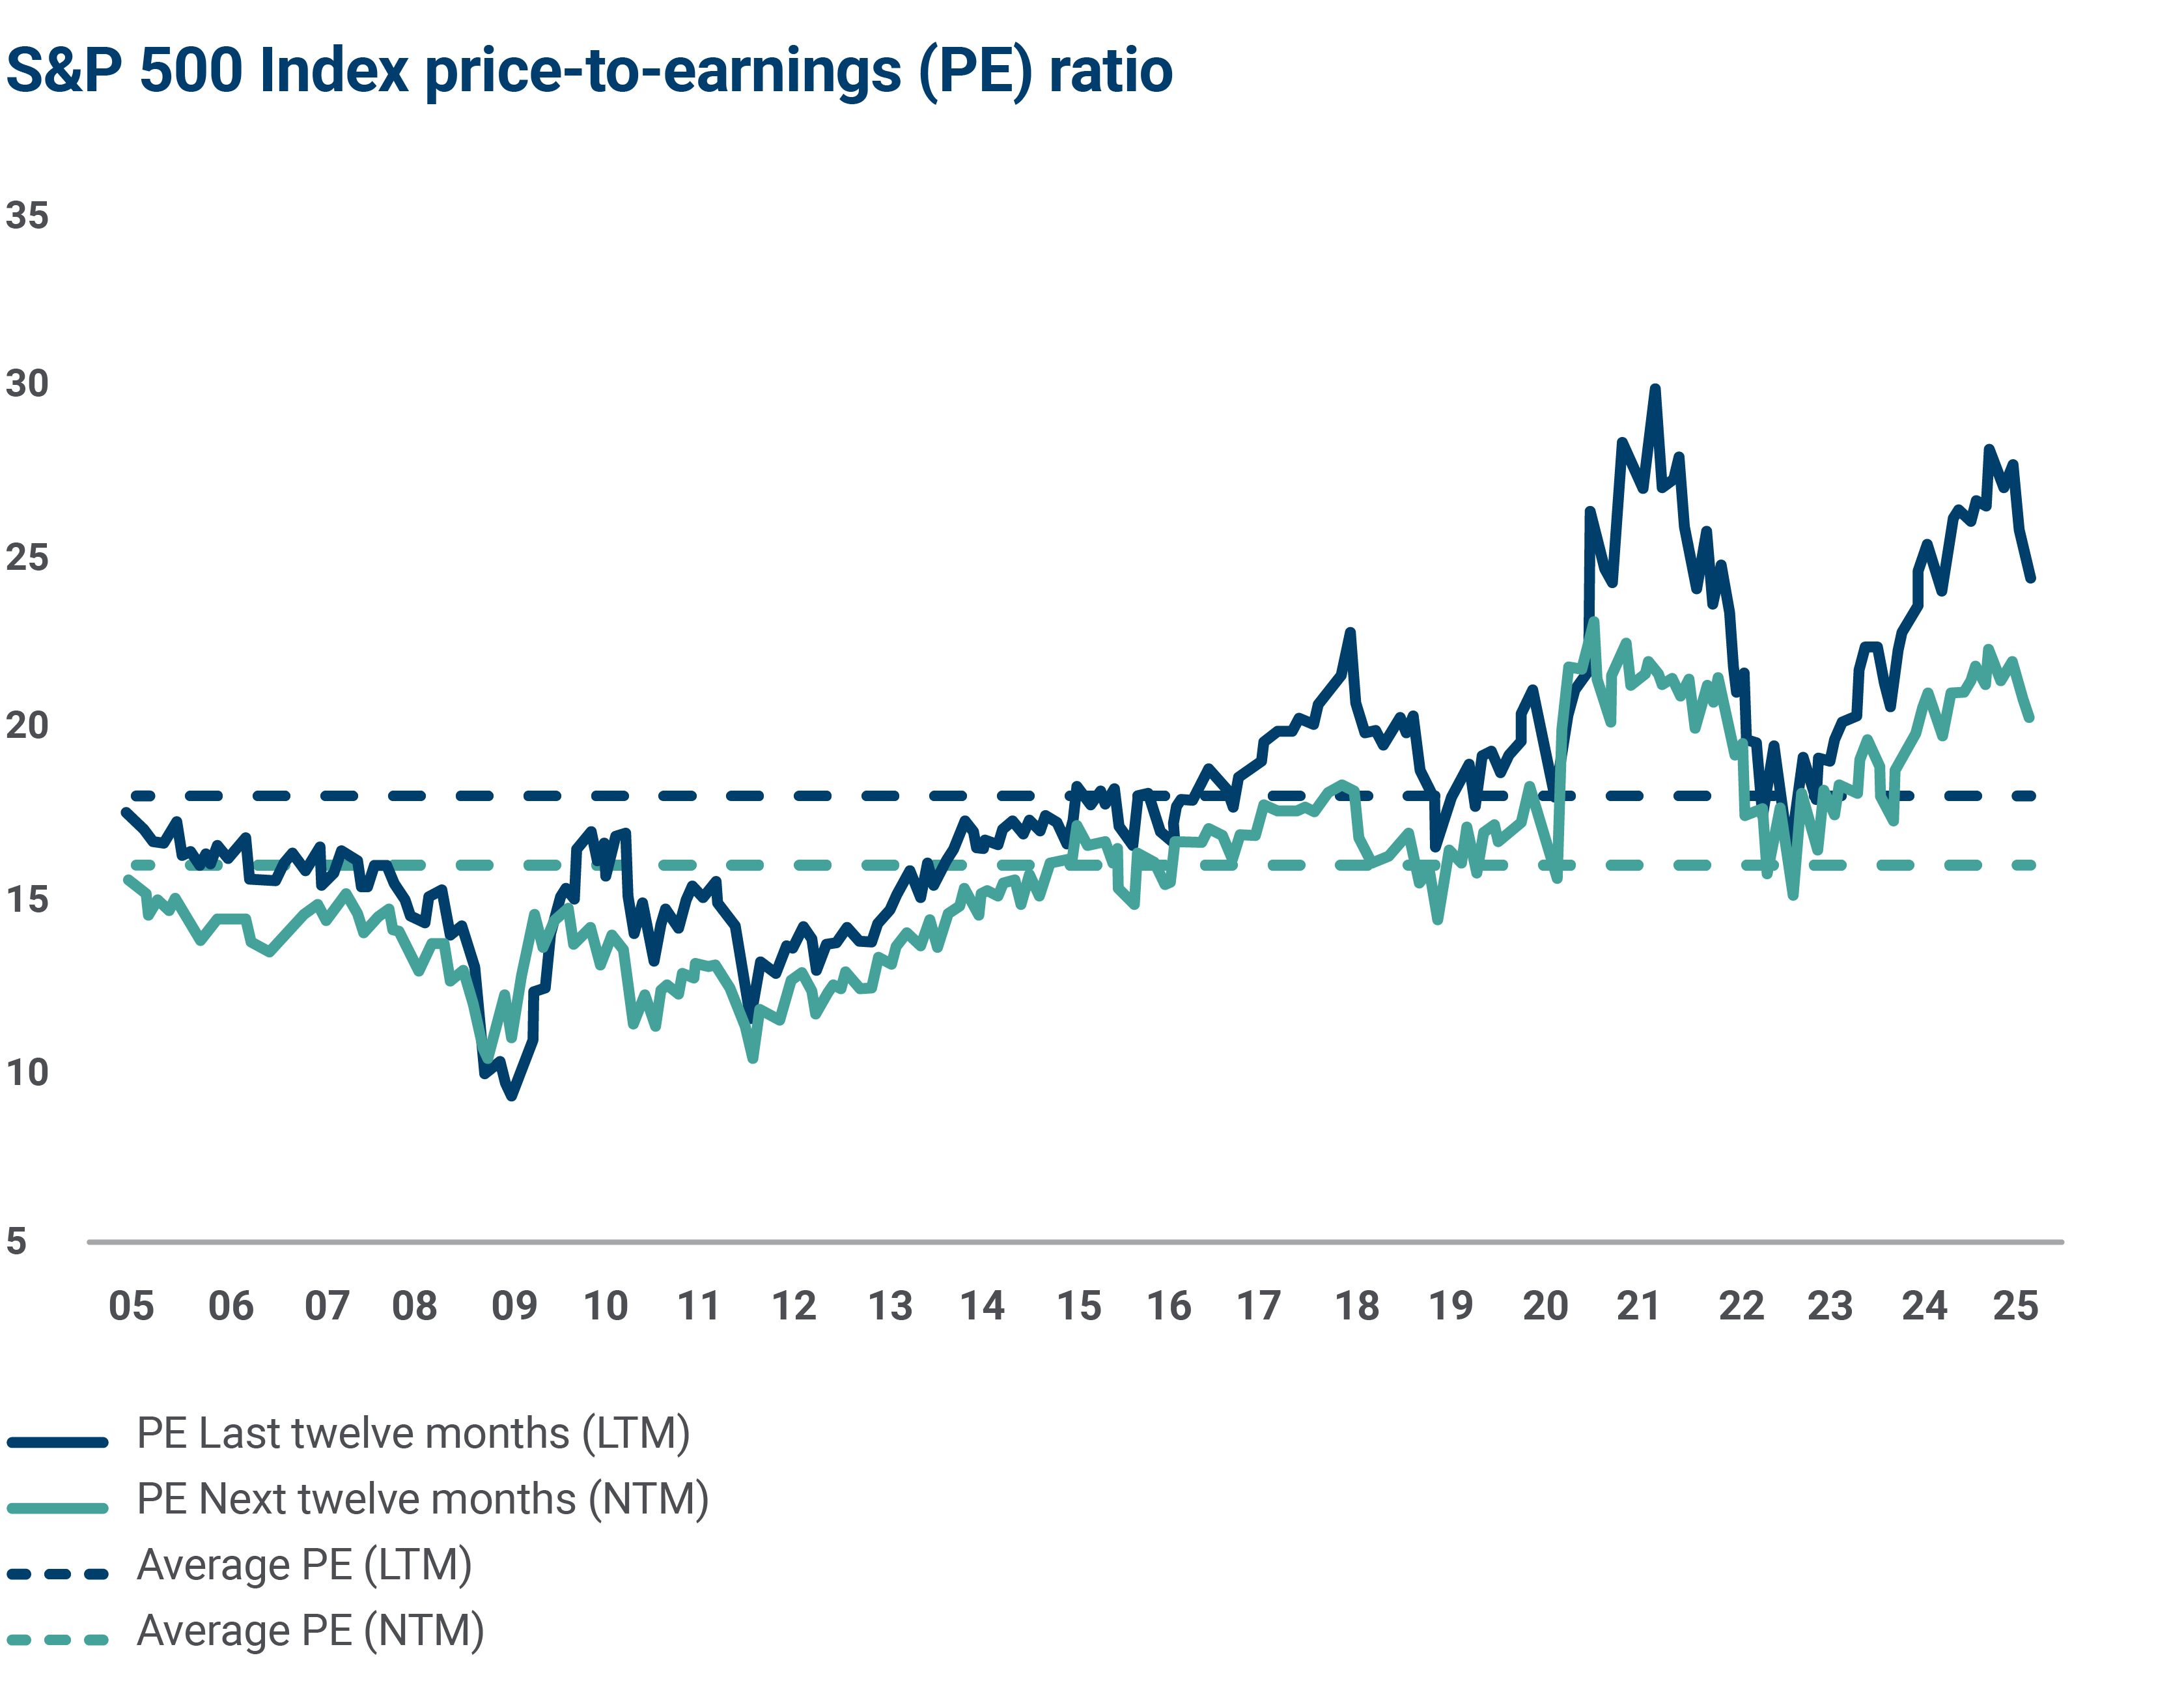
Sources: FactSet, American Enteriprise Investment Services, Inc. Data as of 3/31/2025. These figures are shown for illustrative purposes only.
Connect with an Ameriprise financial advisor
To review your long-term investment strategy, your asset allocation or your risk tolerance, reach out to an Ameriprise financial advisor. They can help prepare your portfolio to weather market uncertainty and stay on track toward your financial goals.
Or, request an appointment online to speak with an advisor.
At Ameriprise, the financial advice we give each of our clients is personalized, based on your goals and no one else's.
If you know someone who could benefit from a conversation, please refer me.
Background and qualification information is available at FINRA's BrokerCheck website.