Assessing the case “For” and “Against” stocks after difficult start to 2025
ANTHONY SAGLIMBENE – CHIEF MARKET STRATEGIST, AMERIPRISE FINANCIAL
WEEKLY MARKET PERSPECTIVES — March 31, 2025

Elevated tariff uncertainty, ongoing concerns about growth, and now, new stagflation fears rattled investors and sent stock prices lower last week. The S&P 500 Index and NASDAQ Composite fell for the seventh week in the previous nine, with both indexes on pace for their worst months since 2022.
This week, further details from the White House on its reciprocal tariff strategy are expected. Also, the always-important nonfarm payrolls report on Friday will be closely monitored for signs of cracks, given deteriorating confidence levels and mounting growth fears.
Last week in review:
-
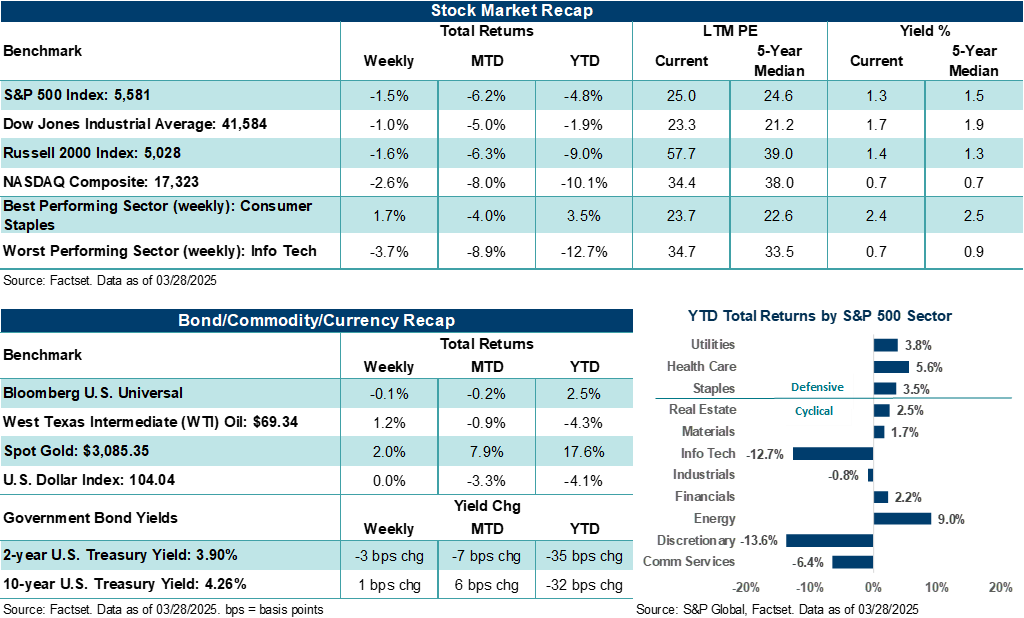
The S&P 500 Index fell 1.5%. The U.S. stock barometer is down over 9.0% from its February 19, 2025, high and off nearly 7.0% since Inauguration Day on January 20, 2025.
-
The NASDAQ Composite dropped 2.6%. On Friday, the tech-heavy composite fell over 2.0% on the day, marking its fifth such decline of 2.0% or more on a trading day this month. That’s the most since the Index did so in June 2022, according to Dow Jones Market Data.
“Unfortunately, the second quarter may bring with it as much uncertainty and volatility for investors as the first quarter of the year. Nevertheless, that point should not cause one to deviate from a well-diversified portfolio.”
Anthony Saglimbene - Chief Market Strategist, Ameriprise Financial
- The Dow Jones Industrials Average (-1.0%) and Russell 2000 Index (-1.6%) also fell on the week. The Russell 2000 Index is down 9.0% for the year and off more than 17% from its November 25, 2024, high.
- U.S. Treasury prices remained firm on the week, with 2-year and 10-year yields mostly unchanged.
- Gold prices pushed further into record territory, with the precious metal finishing the week at $3,085.35 per ounce. Gold is up over +16.5% year-to-date, with investors favoring the real asset as a stable port in the storm.
- West Texas Intermediate (WTI) crude gained +1.2% — its third consecutive week of gains. The U.S. Dollar Index ended basically flat.
- President Trump signed an executive order imposing permanent tariffs on automobiles not produced in the U.S., which is set to take effect on April 2. According to the White House, the initial tariff rate will start at 2.5% before increasing to 25%. Several analyst estimates suggest the cost of a new vehicle in the U.S. could rise by as much as $5,000 to $10,000, while JPMorgan estimates used cars, based on increased demand, could see prices rise on average between +9.0%-12.0%. Retaliatory tariffs from Canada and Mexico, as well as other countries, could further pressure auto prices to the upside.
- The core Personal Consumption Expenditures (PCE) Price Index, or the Federal Reserve’s preferred inflation measure, came in hotter than expected for February. On an annualized basis, core PCE stood at +2.8% at the end of February, above the +2.7% rate in January. However, rate cut expectations remained largely unchanged after the report, with most of the market not expecting a Fed rate cut until the June meeting.
- Signs of a stretched consumer fanned the flames of stagflation fears (i.e., slowing growth amid elevated inflation) last week as March consumer confidence dropped for the fourth straight month, and a final look at March Michigan sentiment showed inflation expectations rising more than initially reported. Finally, a preliminary look at March manufacturing activity showed the measure again falling into contraction, with output hitting a three-month low.
Assessing the case “for” and “against” stocks after a difficult start to 2025.
No doubt, the first few months of 2025 have been pretty tough for investors to swallow. Major U.S. stock indexes are on pace to close out the first quarter meaningfully lower, and after many investors expected stocks to keep gravitating higher following two strong years of returns. However, tariff uncertainty has put an unexpected stranglehold on markets this year, while elevated stock valuations and growing concerns over stretched expectations among a handful of artificial intelligence leaders have quickly soured sentiment. Although several major areas of the market have corrected from their recent highs and outlooks for the year have become more guarded, we believe maintaining a balanced perspective of current conditions is critical during periods of market stress. Below is our bull and bear case for stocks moving forward as we currently see them.
The bullish case for stocks:
- The stock market decline feels worse than it really is. Notably, corrections of 10% or more happen more frequently than investors typically assume or remember. Most S&P 500 sectors are actually higher in 2025, with much of the selling pressure this year coming in Big Tech-related areas, where expectations and valuations were elevated coming into the year.
- The U.S. economy and S&P 500 corporate profits are expected to grow in Q1 and beyond. We forecast U.S. GDP to come in at +0.8% in Q1’25 and expand over the coming quarters, while FactSet estimates seven of eleven S&P 500 sectors will grow profits on an annualized basis in the first quarter of this year. Importantly, corporate profit margins sit at very healthy levels relative to history, which could help companies navigate tariff uncertainty and stabilize demand and profits, particularly if tariff impacts are temporary.
- Investors may be overly sour on the market outlook over the coming months, which offers a contrarian signal, in our view. Retail investors are as bearish on forward stock returns today as they typically are during much larger drawdown periods. Meanwhile, consumers in the Conference Board’s monthly survey are also pretty dire on the stock outlook. In addition, U.S. Economic Policy Uncertainty recently spiked to levels last seen during COVID-19. On average, when sentiment is this weak and uncertainty about policy is this high, some clarity eventually forms. As a result, stock performance tends to improve over the next six to twelve months.
- Finally, seasonality trends could improve, as April through July collectively is historically a solid stretch for stock prices over the last twenty years. In addition, rapid drops of +10.0% or more, accompanied by oversold technical conditions over the near term (without a recession), tend to be solid longer-term buying opportunities. Bottom line: Stock corrections are healthy and a necessary function in the market that allows bull markets to continue.
The bearish case for stocks:
- Tariff uncertainty is a meaningful threat to our outlook and could lower our assessment of growth and profits over the coming quarters. Stock prices could see further selling pressure if the cumulative threat of tariff announcements becomes an entrenched reality and begins to sap CEO confidence, raise inflation, lower employment, and generally slow U.S. and global economic conditions. We believe tariff announcements, as presented thus far, could lower U.S. GDP growth by 0.5% to 1.0% annually, or possibly more, depending on how conditions evolve. Stock prices would likely struggle to gain traction in this environment. How much more than what has already been discounted in current stock prices is up for debate.
- Stock corrections typically see further downside versus what we’ve seen so far. According to Bespoke Investment Group, the average S&P 500 Index correction since 1952 has produced a peak-to-through drop of 18.2% and a median drop of 15.7%. And given we are likely to see a more volatile April as more tariff announcements come into view and companies comment on the threats in Q1 earnings calls, there may be more short-term stock pain ahead.
- Technical conditions remain weak. The S&P 500 is trading below its longer-term trend line and has failed to reclaim the average. Without a catalyst, stocks may find it hard to break out of their downtrend over the near term.
- Stocks aren’t cheap, even after recent declines. The S&P 500 currently trades at roughly 24x its last twelve months of earnings, which is meaningfully above the ten-year average of 21.7x. In addition, U.S. stocks, in aggregate, currently have a market capitalization value of just under $60 trillion, which is almost 2x what U.S. GDP is running at. The famed investor Warren Buffet has often stated the ratio should be closer to one-to-one when the stock market is fairly valued with GDP growth. Regardless, outside of some pockets in technology, recent stock declines have not reset overall stock valuations in aggregate. As a result, stock valuations could see further pressure if earnings estimates fall more aggressively in the coming weeks and months and economic conditions worsen.
Unfortunately, the second quarter may bring with it as much uncertainty and volatility for investors as the first quarter of the year. Nevertheless, that point should not cause one to deviate from a well-diversified portfolio. In our view, investors should hold high-quality assets across their portfolio, ensure their allocations match their risk tolerance, and take a longer-term view of the current market stress, which, historically, can create opportunities to dollar-cost average into high-quality assets.
The week ahead:
As has been much of the case this year, headlines from Washington will likely dominate investors’ attention this week as tariff announcements take center stage. U.S. employment conditions will also be top-of-mind, with Friday’s March nonfarm payrolls expected to decelerate from February levels.
- On Wednesday, April 2, the Trump administration is expected to unveil a slate of so-called “reciprocal” tariffs against U.S. trading partners. To date, there has been very little clarity on what and who these tariffs will target out of the gate. Autos, semiconductors, pharmaceuticals, various commodities, Europe, Japan, and others are all potentially in President Trump’s crosshairs. Market volatility could escalate depending on what and who is targeted.
- Along with the latest reports on job openings and private payrolls during the week, March nonfarm payrolls are expected to decelerate to +122,500 jobs from +151,000 jobs in February. The unemployment rate is expected to tick higher to 4.2% from 4.1%. For obvious reasons, signs of stress in the job market this week may not be greeted well by investors.