Narrow pillars: AI boom or bubble?
ANTHONY SAGLIMBENE – CHIEF MARKET STRATEGIST, AMERIPRISE FINANCIAL
WEEKLY MARKET PERSPECTIVES — October 6, 2025

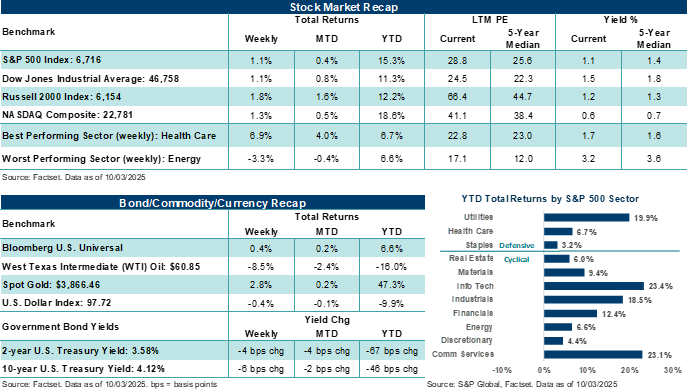
Major U.S. stock benchmarks finished last week higher, more than recovering the prior week's losses. The S&P 500 Index, NASDAQ Composite, and Dow Jones Industrials Average all hit record highs, despite a U.S. government shutdown, which now delays key economic data important to monitoring labor trends.
This week, economic data was already expected to be light, and that was before a government shutdown put scheduled releases on trade and weekly jobless claims on ice until Congress passes a continuing resolution.
Last week in review:
-
The S&P 500 Index and the NASDAQ Composite each rose by more than +1.0%. The S&P 500 has recorded 31 new all-time highs thus far in 2025.
-
The Russell 2000 Index led major averages higher for the week, gaining +1.7%, while the Dow gained roughly +1.0%.
- U.S. Treasury yields dipped lower, Gold posted another record high, and West Texas Intermediate (WTI) crude dropped 8.5% amid expectations for further OPEC+ production hikes. The U.S. Dollar Index ended slightly lower.
- Stocks looked past the U.S. government shutdown last week after funding lapsed on October 1. Equity market performance has historically been unfazed by prior shutdowns. However, an extended shutdown that continues to delay critical economic data on jobs and inflation could lead to increased equity volatility in the near term.
- In the data investors received last week, the economic picture appeared mixed. September ADP private payrolls fell to their weakest level since March 2023 (reinforcing softening labor trends), and August job openings surprised to the upside. September ISM Manufacturing came in broadly in line with expectations, accompanied by stronger employment, while ISM Services missed expectations, with employment contracting last month.
“It's possible that some level of investment in the AI buildout today may not yield the degree of return investors hope for, and valuations among some of the leaders would likely need to be adjusted downward. However, given the size and scale of companies and industries that have yet to tap into AI in a meaningful way, we are less concerned that we are on the cusp of a dot-com bubble just yet.”
Anthony Saglimbene - Chief Market Strategist, Ameriprise Financial
Narrow pillars: AI boom or bubble?
Ahead of the third quarter earnings season and major U.S. stock averages continuing to make new highs, investors' attention has shifted back to somewhat familiar questions they've grappled with over recent quarters: What inning is the artificial intelligence (AI) boom in? And by extension, is AI and the stocks driving the advanced technology currently in a bubble?
Simply, we're not smart enough to answer those questions directly, and we're somewhat skeptical of market pundits who combine hard data and fast opinion to generate direct answers and sensational headlines. What we will say is that a correction across Technology and the AI-driven names driving broader markets higher this year will occur at some point, likely when AI leaders begin to see softer stock trends. This, in turn, could lead to increased concerns about current capital expenditure (capex) spending, which could then fuel increased selling pressure should profit results no longer match expectations. It's important to remember that stocks and investment themes don't run higher in perpetuity, and the current AI revolution that's propelling U.S. stock benchmarks higher today is unlikely to be any different. All cycles eventually end, which are generally only visible in hindsight. What investors should be asking today is whether bumps in the AI road still lead to longer-term gains for the industry and stocks as a whole, and if the ultimate end to the theme comes gradually or violently. If history is any guide, the internet boom of the 1990s suggests there is more road to run in today's AI boom.
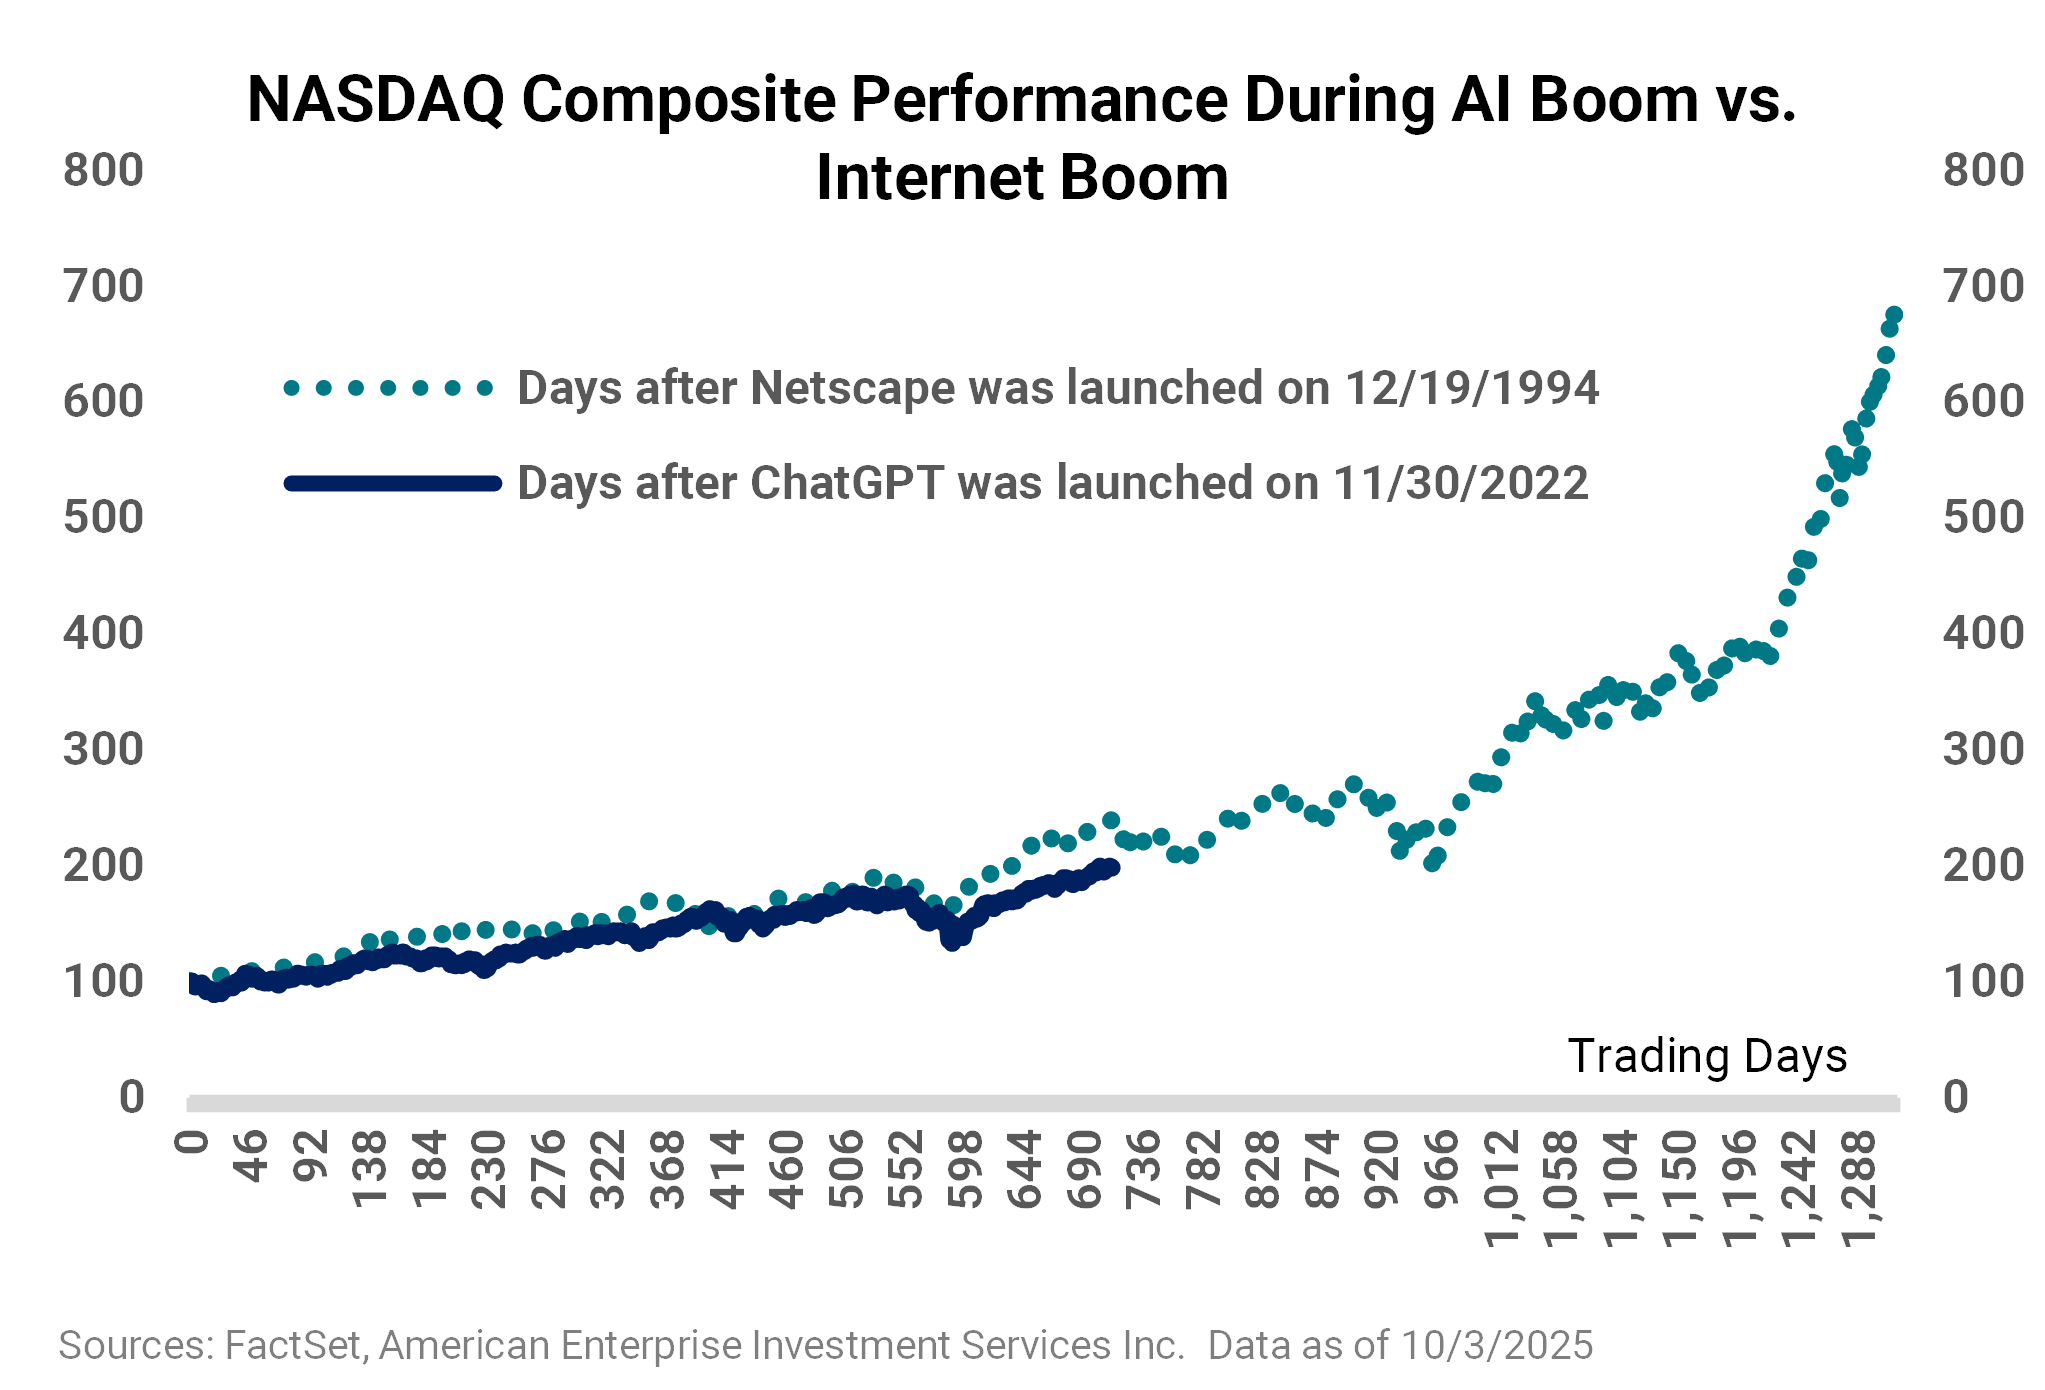
This example is shown for illustrative purposes only and is not guaranteed. It is not possible to invest directly in an index.
Gartner forecasts that $1.5 trillion will be spent on AI worldwide this year across various areas, including infrastructure, application software, services, and semiconductors. That investment is expected to reach over $2 trillion in 2026. At some point, investors will demand a return on investment for the massive AI capex being poured into hardware, models, services, and the like, from the companies currently footing the bill. Some believe the returns from AI tomorrow may not merit the magnitude of investments made today. While that view is debatable, it's not without merit. Similar to the telecom and related companies of the 1990s that invested heavily in laying massive amounts of fiber optic cable into the ground, which went unused for years following the dot-com bust, not all companies survived the downturn or reaped the spoils of their investments.
That said, we're comfortable stating that the fiber optic example is not entirely analogous to today's AI infrastructure buildout. Most major hyperscalers in the space have healthy, very profitable businesses "outside" of AI and fund their capex investments mostly through free cash flow. Yet, free cash flow levels have been declining across Big Tech over several quarters, as investment in AI has increased, leaving less cash for rainy-day funds, share buybacks, dividends, and other shareholder-friendly endeavors that don't have such aggressive up-front costs. Bottom line: It's possible that some level of investment in the AI buildout today may not yield the degree of return investors hope for, and valuations among some of the leaders would likely need to be adjusted downward. However, given the size and scale of companies and industries that have yet to tap into AI in a meaningful way, we are less concerned that we are on the cusp of a dot-com bubble just yet.
Taking it up a level or two, the top 10% of U.S. households saw their wealth increase by $5 trillion in the second quarter, according to the Federal Reserve. Furthermore, the top 10% of U.S. households held $113 trillion in assets at the end of the second quarter, representing a nearly +60% increase since the start of 2020. For the bottom 50% of U.S. households, wealth grew by $150 billion in the second quarter to $4 trillion, up from $2 trillion at the start of 2020.
Not a surprise, wealth in the U.S. is highly concentrated at the top, and the gap appears to be widening. And while the bottom 50% of U.S. households have seen their fortunes improve over the last five years, the top 10% own roughly 87% of all corporate equities and mutual fund shares in the U.S. Thus, the top 10% by wealth distribution have disproportionately benefited from the S&P 500 Index's nearly +127% cumulative total return since the beginning of 2020. Bottom line: Consumer wealth has grown significantly for the top 10% of U.S. households over recent years, which partly explains why they account for roughly half of all consumer spending at present. When consumers feel wealthy, they tend to spend more freely, which, in turn, benefits the economy.
So, what does that little missive on wealth have to do with AI and whether it's in a bubble or not? Well, wealth in this country is concentrated at the top of the brackets (nothing new there). This group is also responsible for a significant share of consumer spending in the U.S., which plays a pretty large role in driving GDP growth. Strong gains in the stock market have fueled their increasing wealth and willingness to spend. Those strong stock gains, particularly over the last few years, have been propelled higher by Technology and Tech-related stocks. And those tech stocks have been driven higher by a small group of AI and AI-related companies that have run higher on the promise that artificial intelligence will deliver outsized profits in the future, revolutionize computing in the 21st century, and make the trillions of dollars spent today to build the infrastructure worth the investment and lofty valuations.
To put it more simply, financial markets may be standing on narrow pillars at the moment, which could create knock-on effects for the U.S. economy should a small group of consumers become less willing to spend if their stocks, particularly those in Tech and AI, experience a correction, making them feel less wealthy.
Over the coming weeks, investors will receive earnings updates and outlooks from Tech and AI-related companies that will help inform the trajectory of current capex strategies and monetization efforts, which will likely play key roles in how their stocks react post-earnings reports and through year-end. In our view, the AI theme remains durable, companies in the space are likely to report strong Q3 results, and guidance should be positive. Nevertheless, stocks react to how much better or worse results and outlooks come in versus expectations, and AI expectations are currently quite high, in our view. As such, Tech has a high hurdle rate to clear this earnings season. Should companies in this area exceed expectations, broader stock averages could see a smoother trajectory into year-end. However, if the concerns described above become more prevalent, stocks may stumble slightly through the finish line.
Our guidance: A correction across technology, which would likely pull-down broader averages such as the S&P 500, is likely to come at some point, but that's not a reason to avoid Technology, underweight AI leaders today, or reduce broader stock exposure. Recall that, before the dot-com bust, the NASDAQ Composite experienced several periods of correction as it moved higher over multiple years. Following April's reset, we're less concerned about a near-term violent downturn in the AI theme. Instead, we view a potential correction (possibly a 10% decline) as a healthy adjustment and an opportunity to realign expectations with reality. However, the risk of a more volatile downturn increases the longer and higher the AI theme persists without a correction, particularly if expectations continue to stretch higher. Currently, investors may be best served by understanding their overall exposure to Technology and AI-related companies across their portfolio, right-sizing allocations based on risk tolerance, and taking a longer-term view of opportunities and threats in the sector.
We'll finish on this. A market that stands on narrow pillars doesn't necessarily imply an immediate problem. That said, the dynamic does suggest that investors probably have a tighter space to maneuver their portfolios within today, considering the narrow leadership across stocks at the moment. In our view, this suggests that broader diversification strategies and high-quality investments merit serious consideration, particularly while stocks sit at all-time highs.
The week ahead:
- The House is not scheduled to be in session this week. Hence, the Senate will need to pass a clean continuing resolution to fund and reopen the government, which seems unlikely at the start of the week, given the entrenched positions from both sides of the aisle.
- Notably, the Congressional Budget Office estimates roughly 750,000 federal government workers will be furloughed during the shutdown. However, these workers will be counted as employed in the establishment survey, will not receive pay while the government is shut down, and will only receive back pay when they return. If the shutdown extends through October 12-18, the Bureau of Labor Statistics' reference week, furloughed workers would be counted as unemployed in the household survey, which could lead to an increase in the unemployment rate for October. Of greater concern for the economy would be if the White House were to permanently lay off some furloughed workers.
- The September FOMC meeting minutes, a host of Fed speeches, the Fed's consumer credit report, and a preliminary look at the October University of Michigan consumer sentiment survey are scheduled for release this week, despite the ongoing government shutdown.
- The third quarter earnings season will kick off quietly this week, with Constellation Brands, PepsiCo, and Delta Air Lines scheduled to report their results before the big banks start to make more noise on the earnings front next week.