2023: A visual look back at 9 key themes
Ameriprise Investment Research Group

Dec. 18, 2023
2023 was a generally strong year for the U.S. stock market and economy despite periods of volatility and elevated uncertainty.
However, stock leadership was narrow and bond performance struggled as rate volatility persisted. Notably, economic conditions, while strong overall, continued to face headwinds as interest rates remained high.
To help you make sense of this year’s investment landscape, here are 9 key themes — illustrated through charts — that drove the markets and economy in 2023:
1. The strength of tech stocks
By the end of November, the S&P 500 Index was on pace for its best year since 2021, while the NASDAQ Composite was on pace for its best year since 2020. Falling inflation and firm economic trends in the U.S., as well as exuberance around artificial intelligence, helped support growth stocks in 2023. Notably, strong gains across the Magnificent Seven (i.e., Alphabet, Amazon, Apple Inc., Meta, Microsoft, Nvidia and Tesla) have driven most of the stock market’s strength this year. Yet, lingering recession fears and elevated interest rates weighed on more cyclically exposed indexes, such as the Dow Jones Industrials Average and Russell 2000 Index, throughout most 2023.
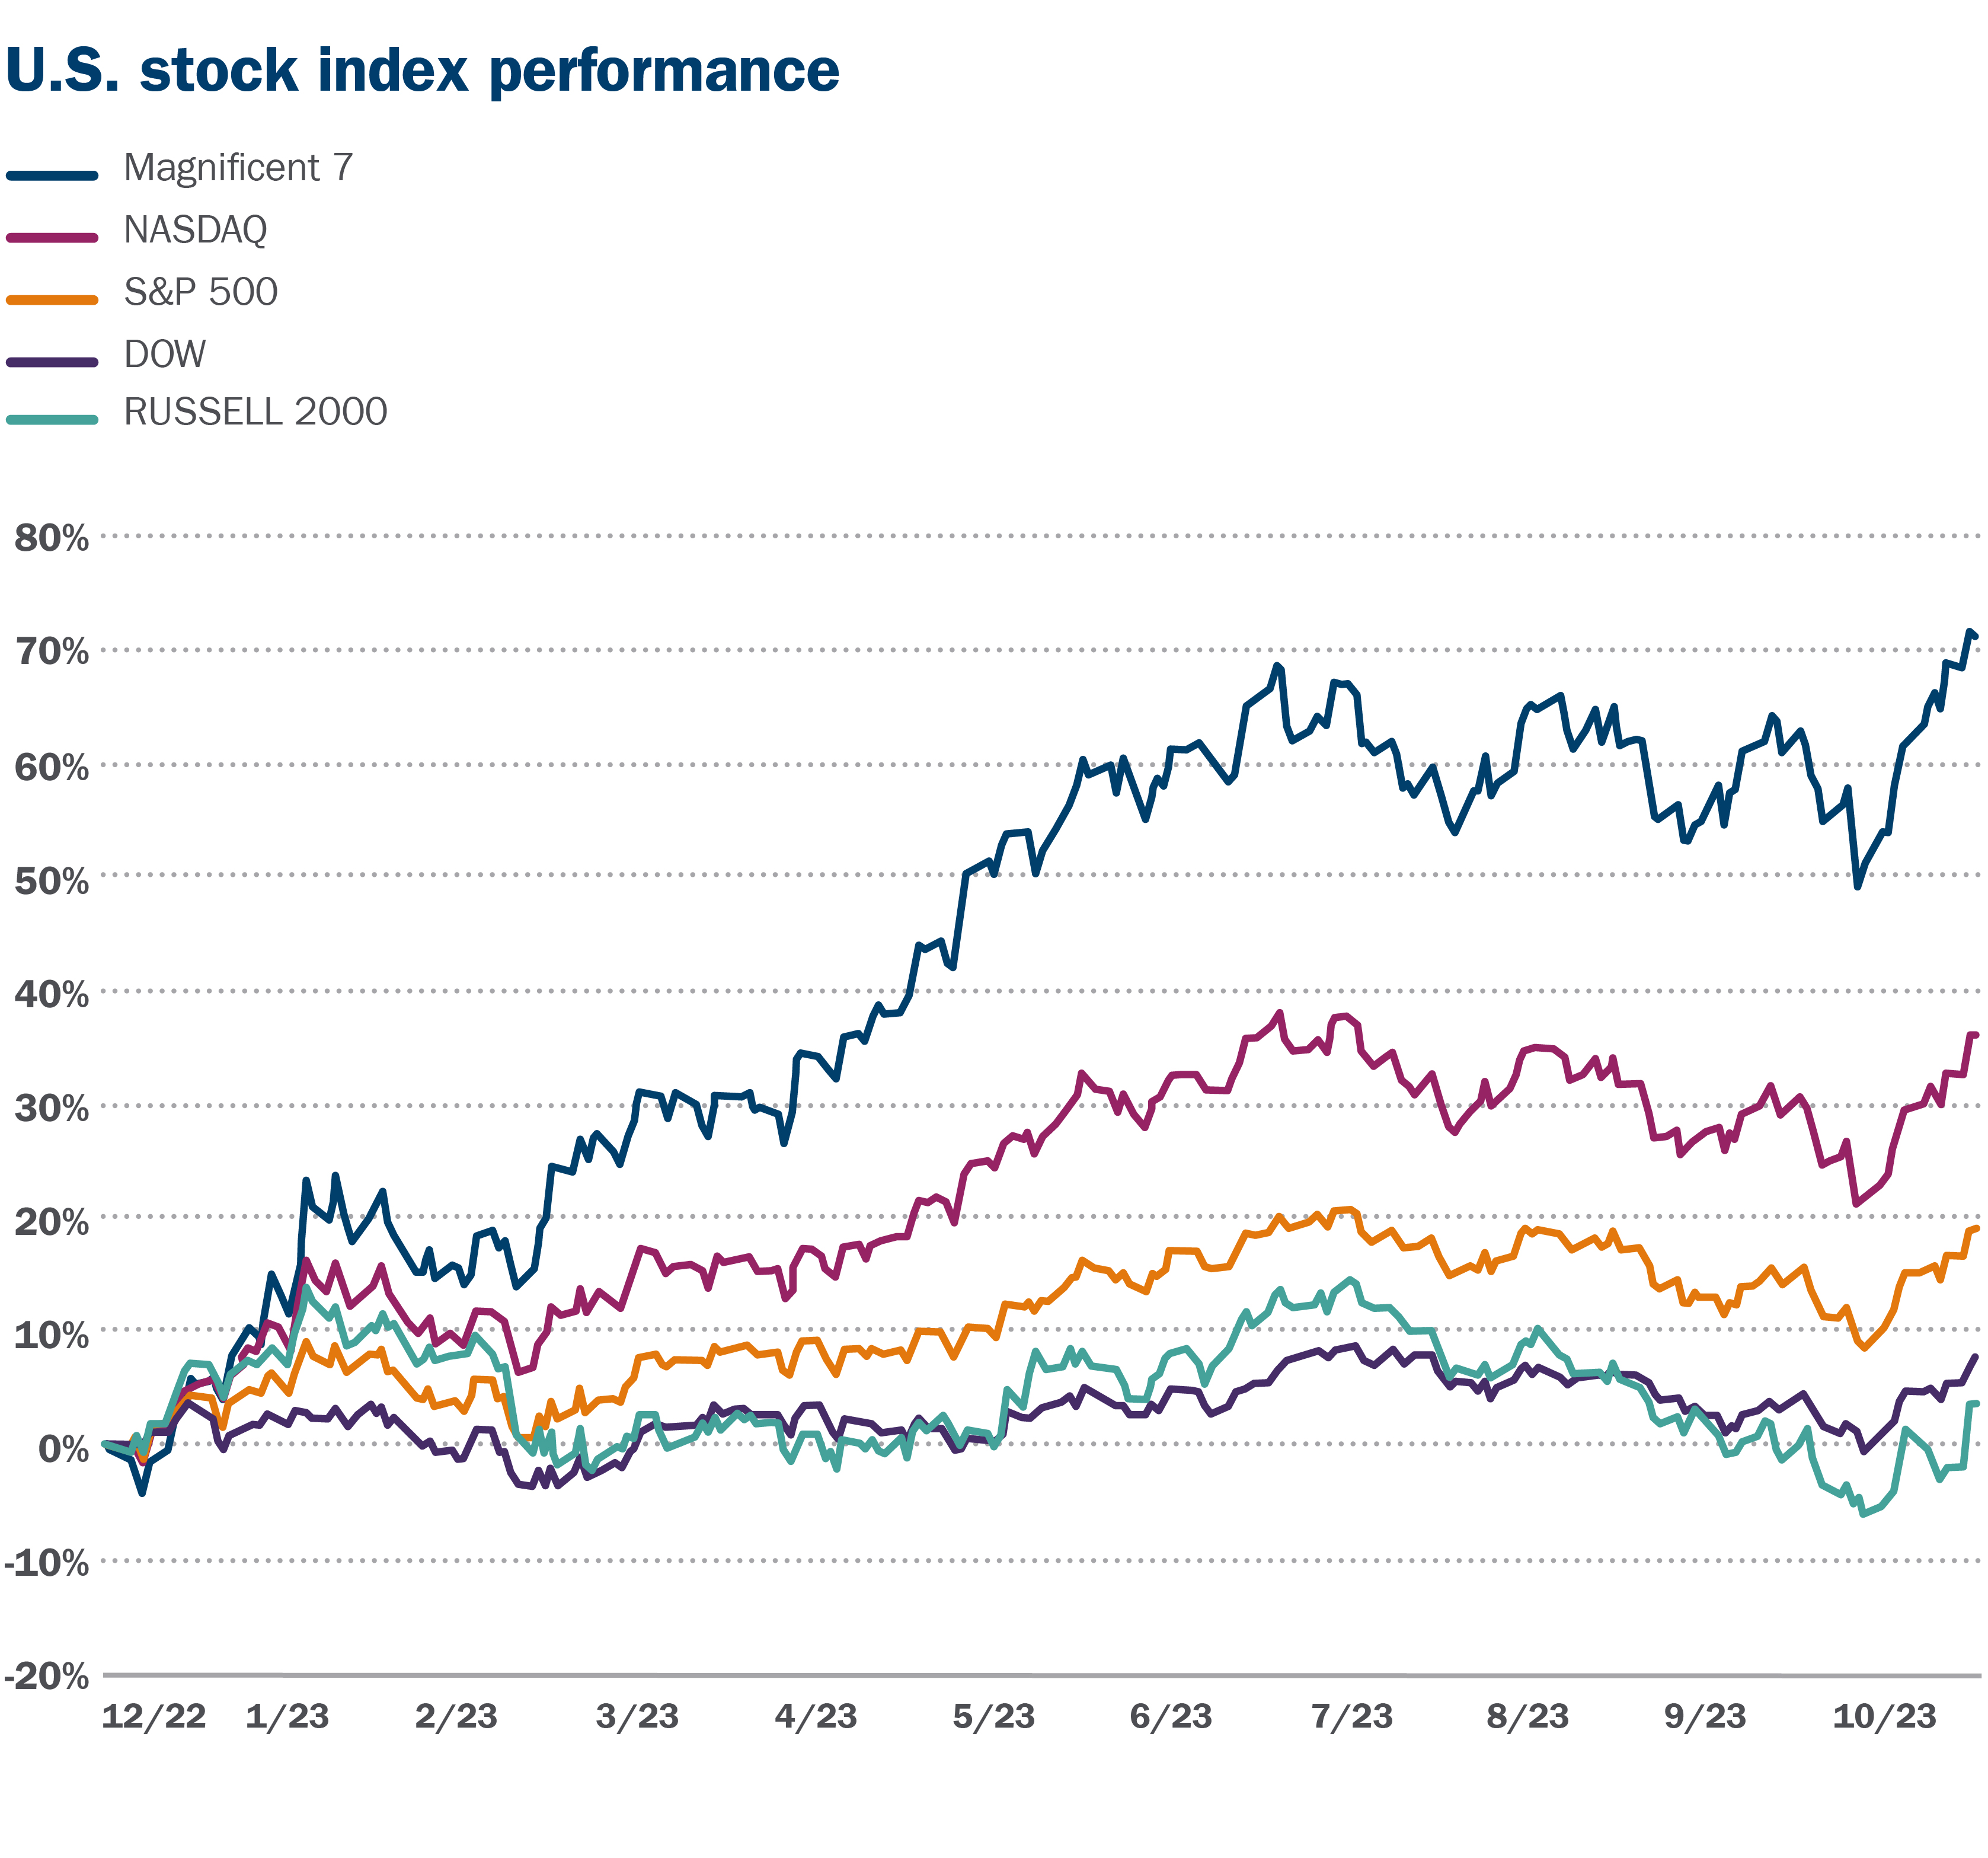
This illustration is shown for illustrative purposes only and is not guaranteed. It does not reflect taxes or investment/product fees or expenses, which would reduce the figures shown here. It is not possible to invest directly in an index. Past performance is not a guarantee of future results.
2. A brighter corporate profit picture
Over the longer term, stock prices track the changes in corporate earnings. With the dollar value of trailing 12-month S&P 500 earnings per share (EPS) falling through much of last year, stocks struggled to make price gains. However, corporate profit trends began to improve in the first half of 2023 and are estimated to continue to grow into next year. Thus, with the corporate profit backdrop looking more favorable, stock prices climbed higher in 2023.
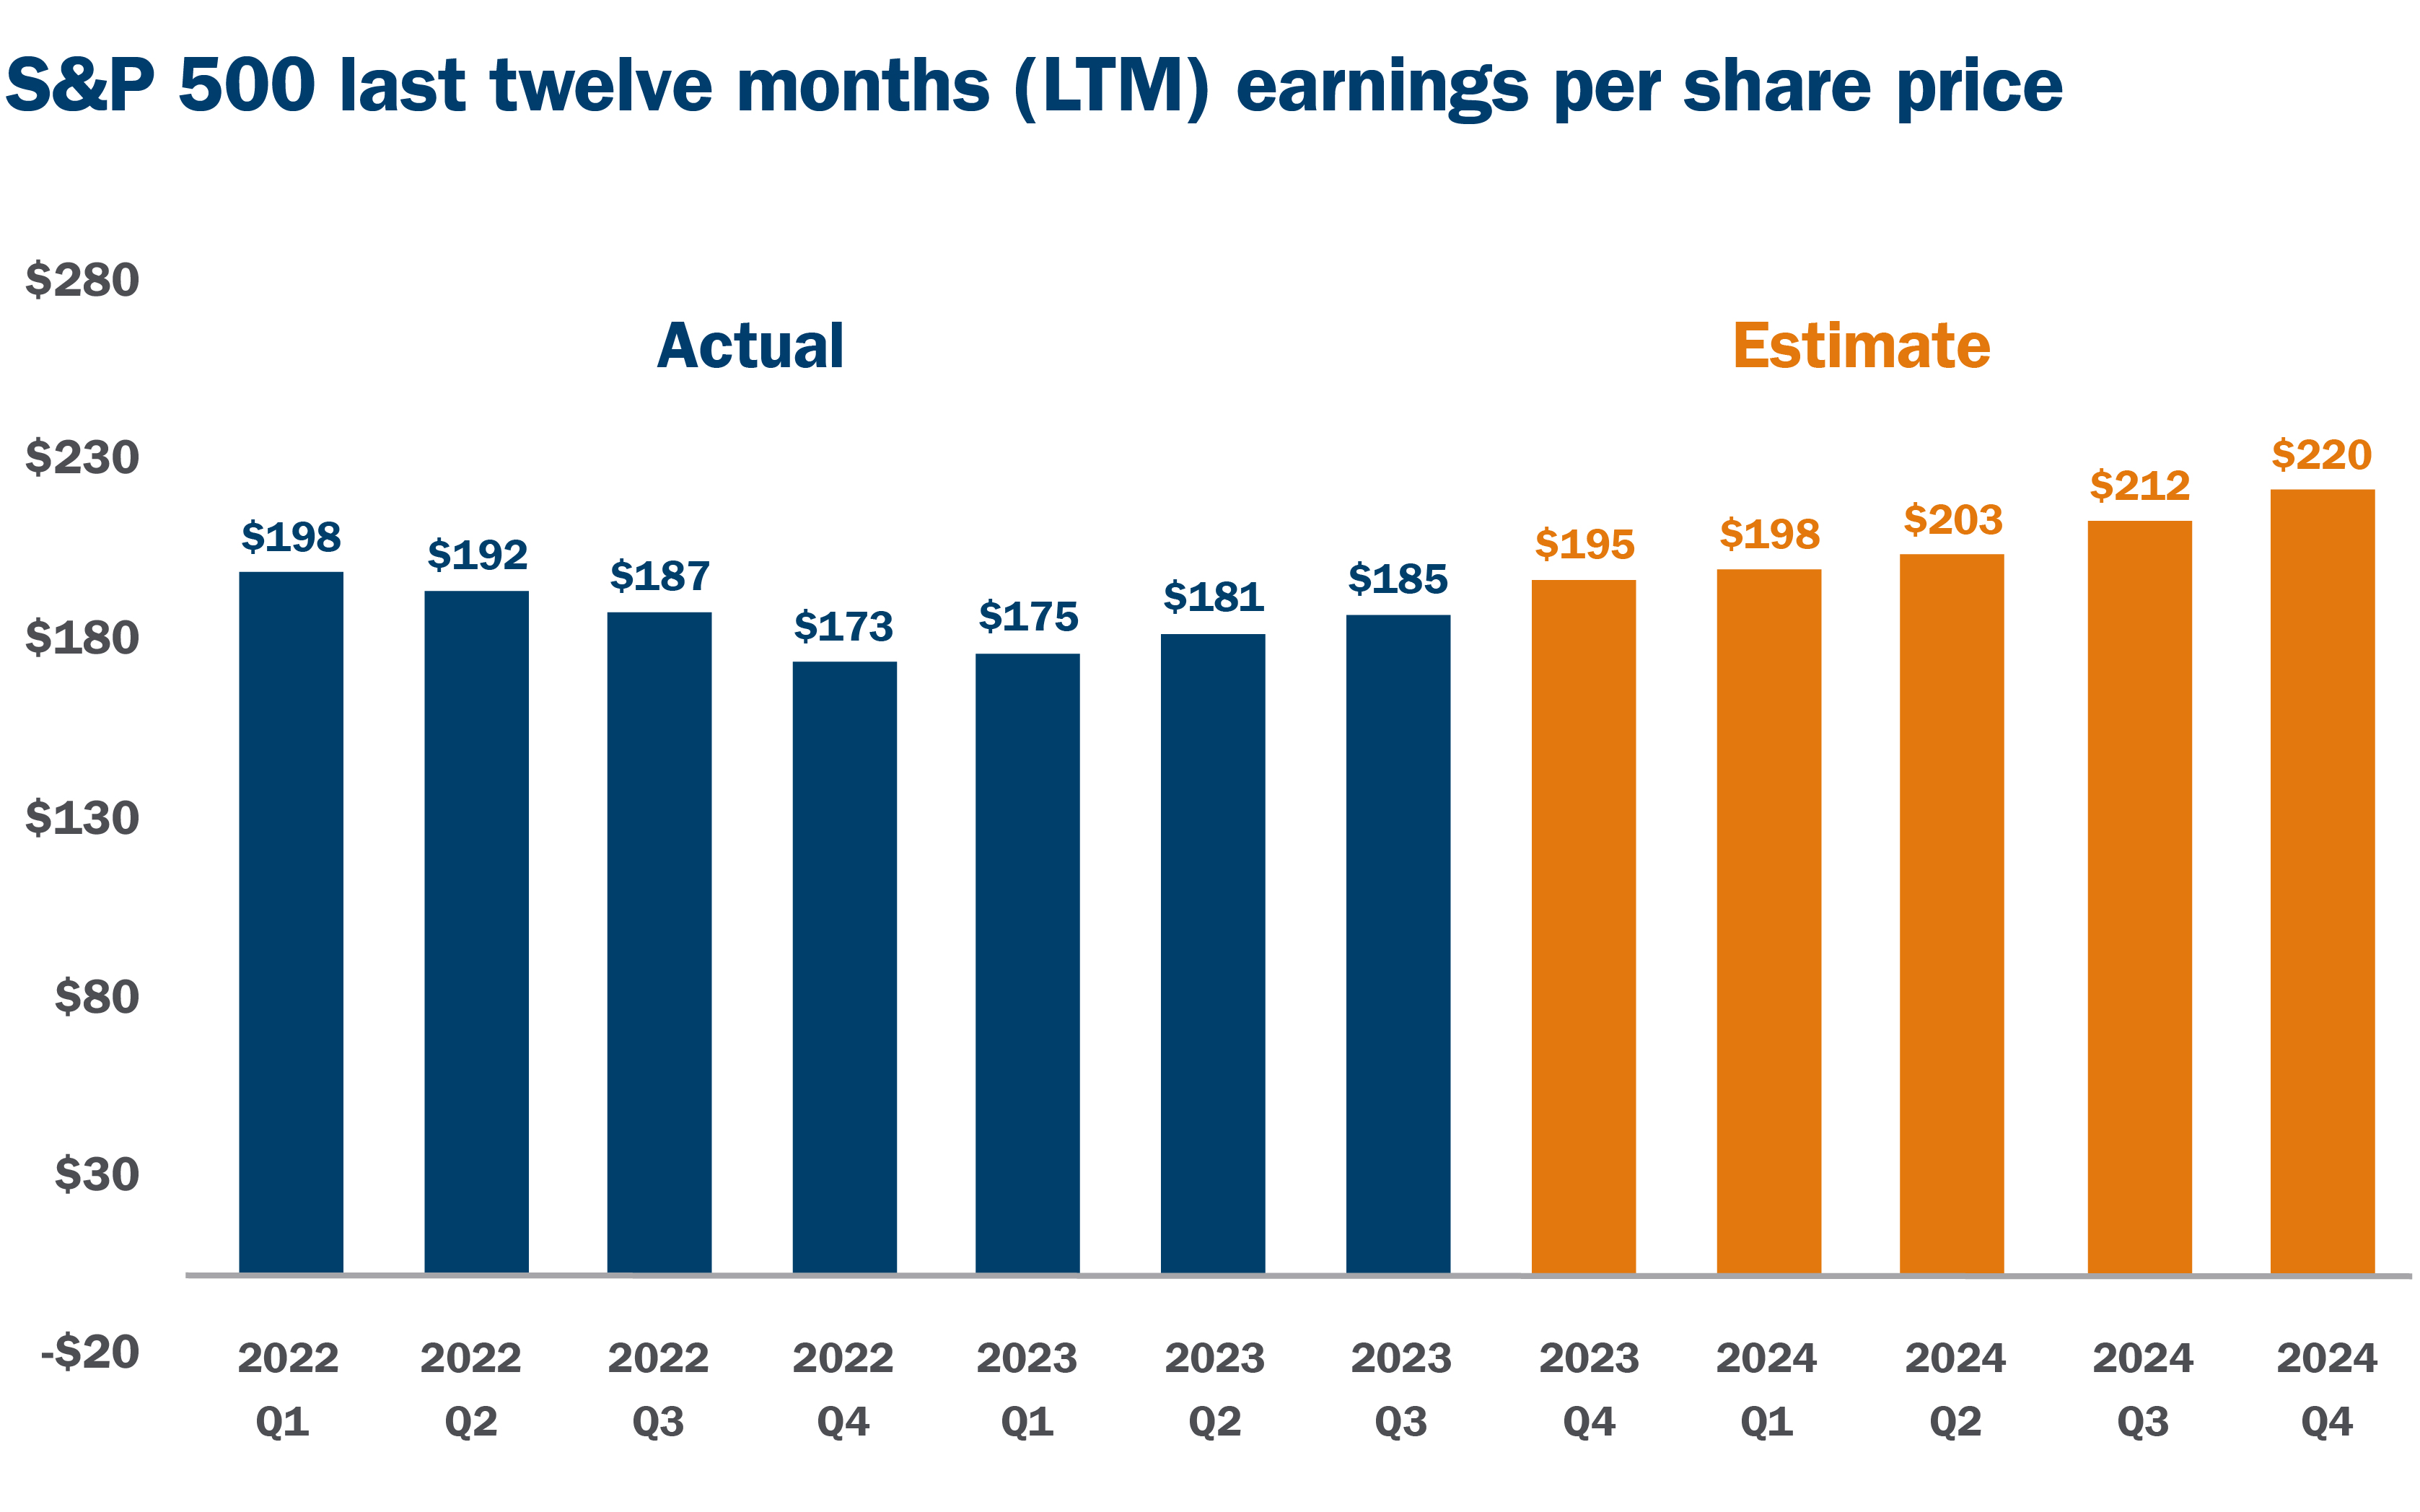
This illustration is shown for illustrative purposes only and is not guaranteed.
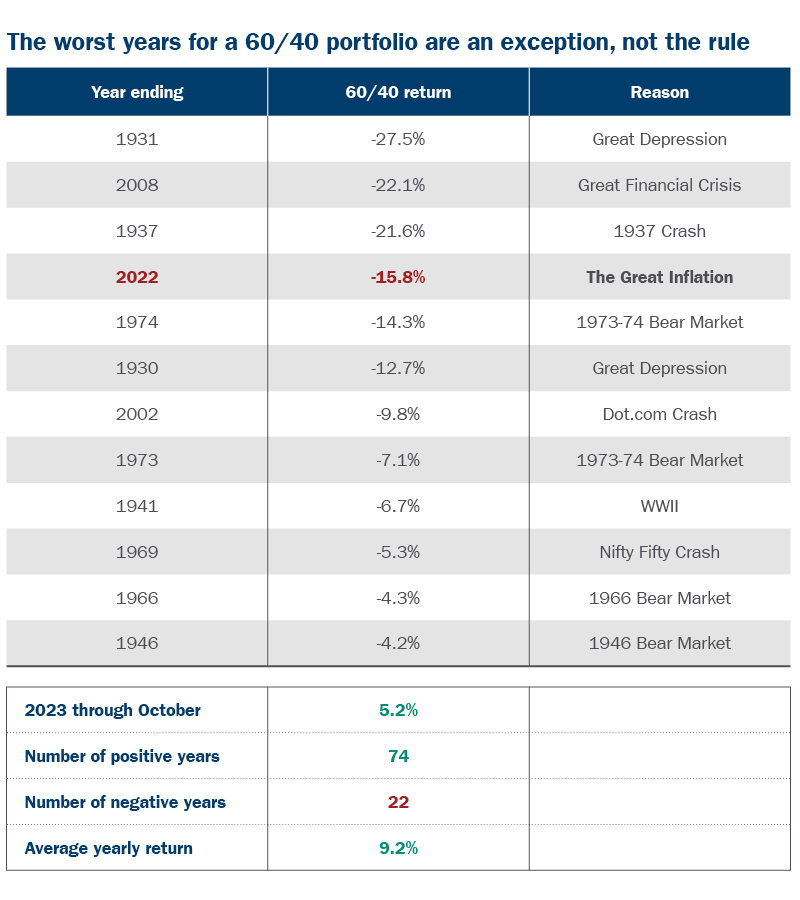
3. A still-kicking 60/40 portfolio
The last few years of stock and bond performance have been difficult for investors to adjust to, as elevated inflation and the rapid rise in bond yields created more extreme volatility in both asset classes. But as the Ameriprise table below shows, the simple 60% stock/40% bond portfolio is hardly dead, and we believe it still adds value/return potential longer-term at the most basic level of diversification.
4. Impressive improvement on the inflation front
Inflation is key to U.S. economic and financial market prospects. Returning inflation to more normalized levels will likely reduce market volatility and could help mitigate recession fears, which have proliferated due to sharply higher interest rates. And fortunately, significant progress was made in alleviating inflation pressures in 2023. Inflation, as measured by the Consumer Price Index (CPI), started 2023 at +6.4% but had eased to 3.1% by November. We currently forecast CPI inflation to reach the Federal Reserve’s target level of about 2% by the middle of 2024.
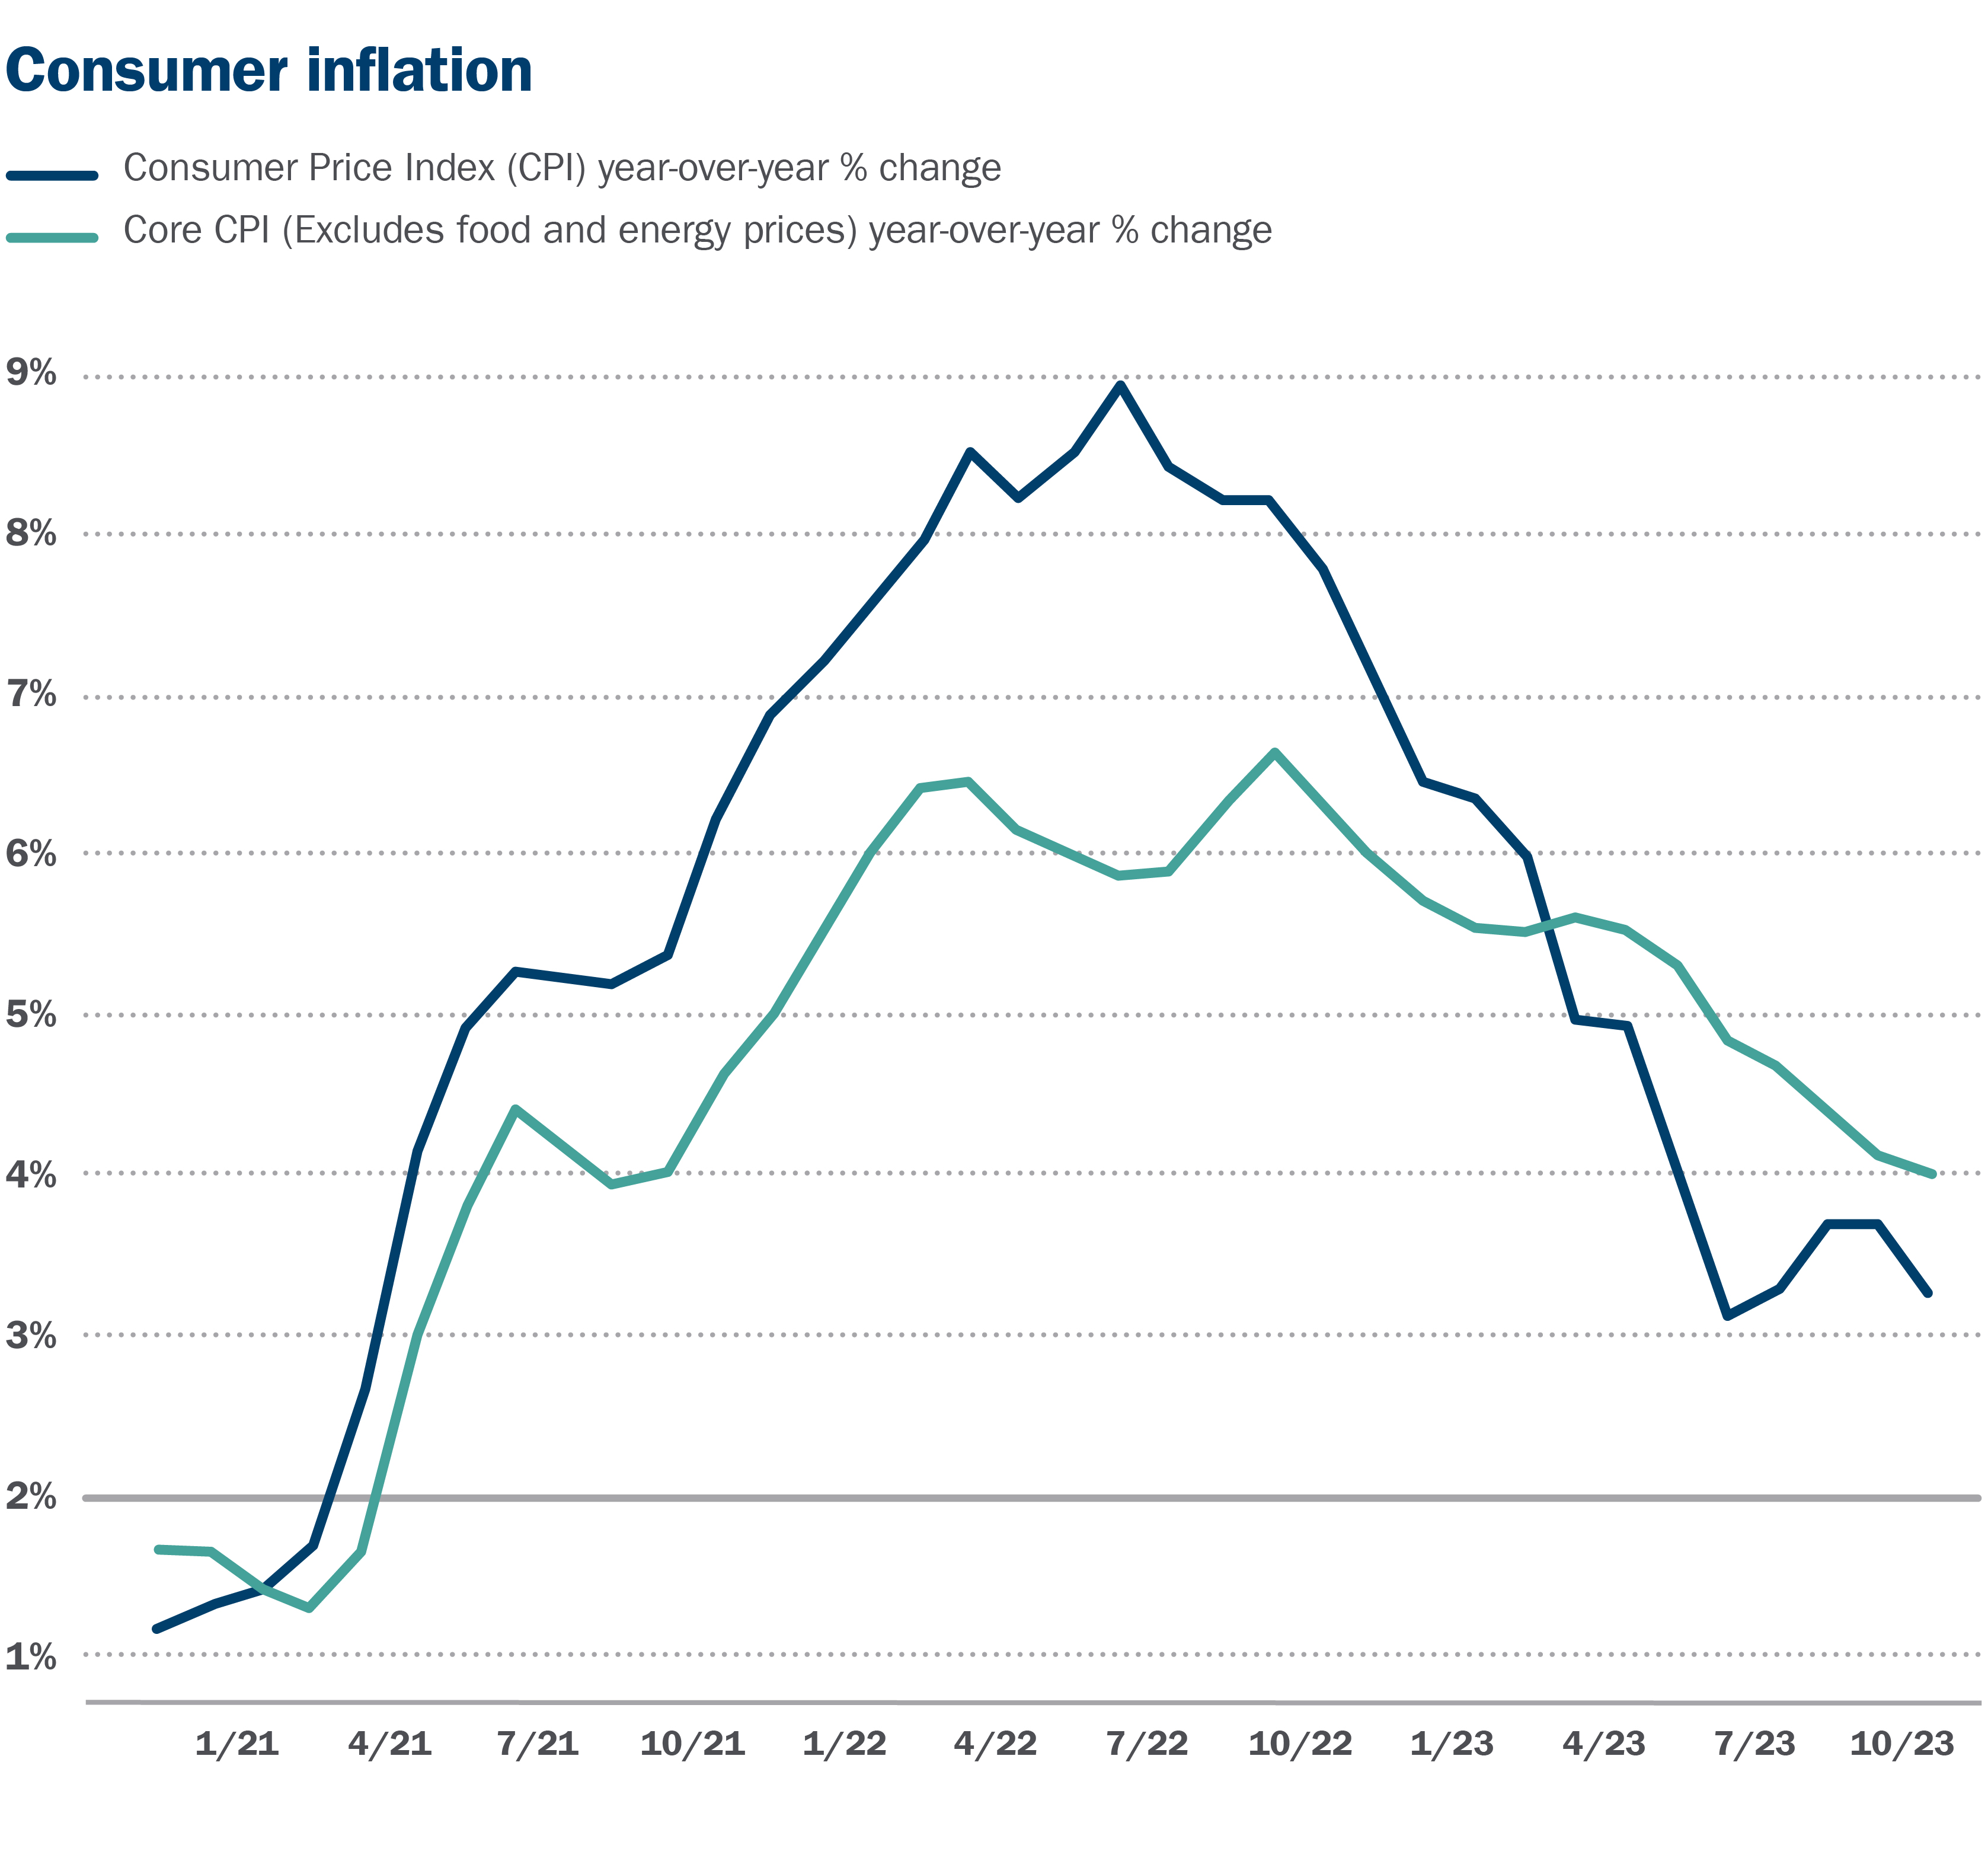
Sources: U.S. Bureau of Labor Statistics. Data as of 10/31/23.
5. Financially healthy consumers
U.S. economic growth was broadly better than expected through the first three quarters of 2023, primarily driven by robust consumer spending. Consumers remain in strong financial shape as we head into 2024, in our opinion, with relatively low debt burdens and a relatively high level of savings. The pace of consumer spending, as well economic growth overall, however, should decelerate in 2024 as we move further away from the fluctuations reverberating from the pandemic period.
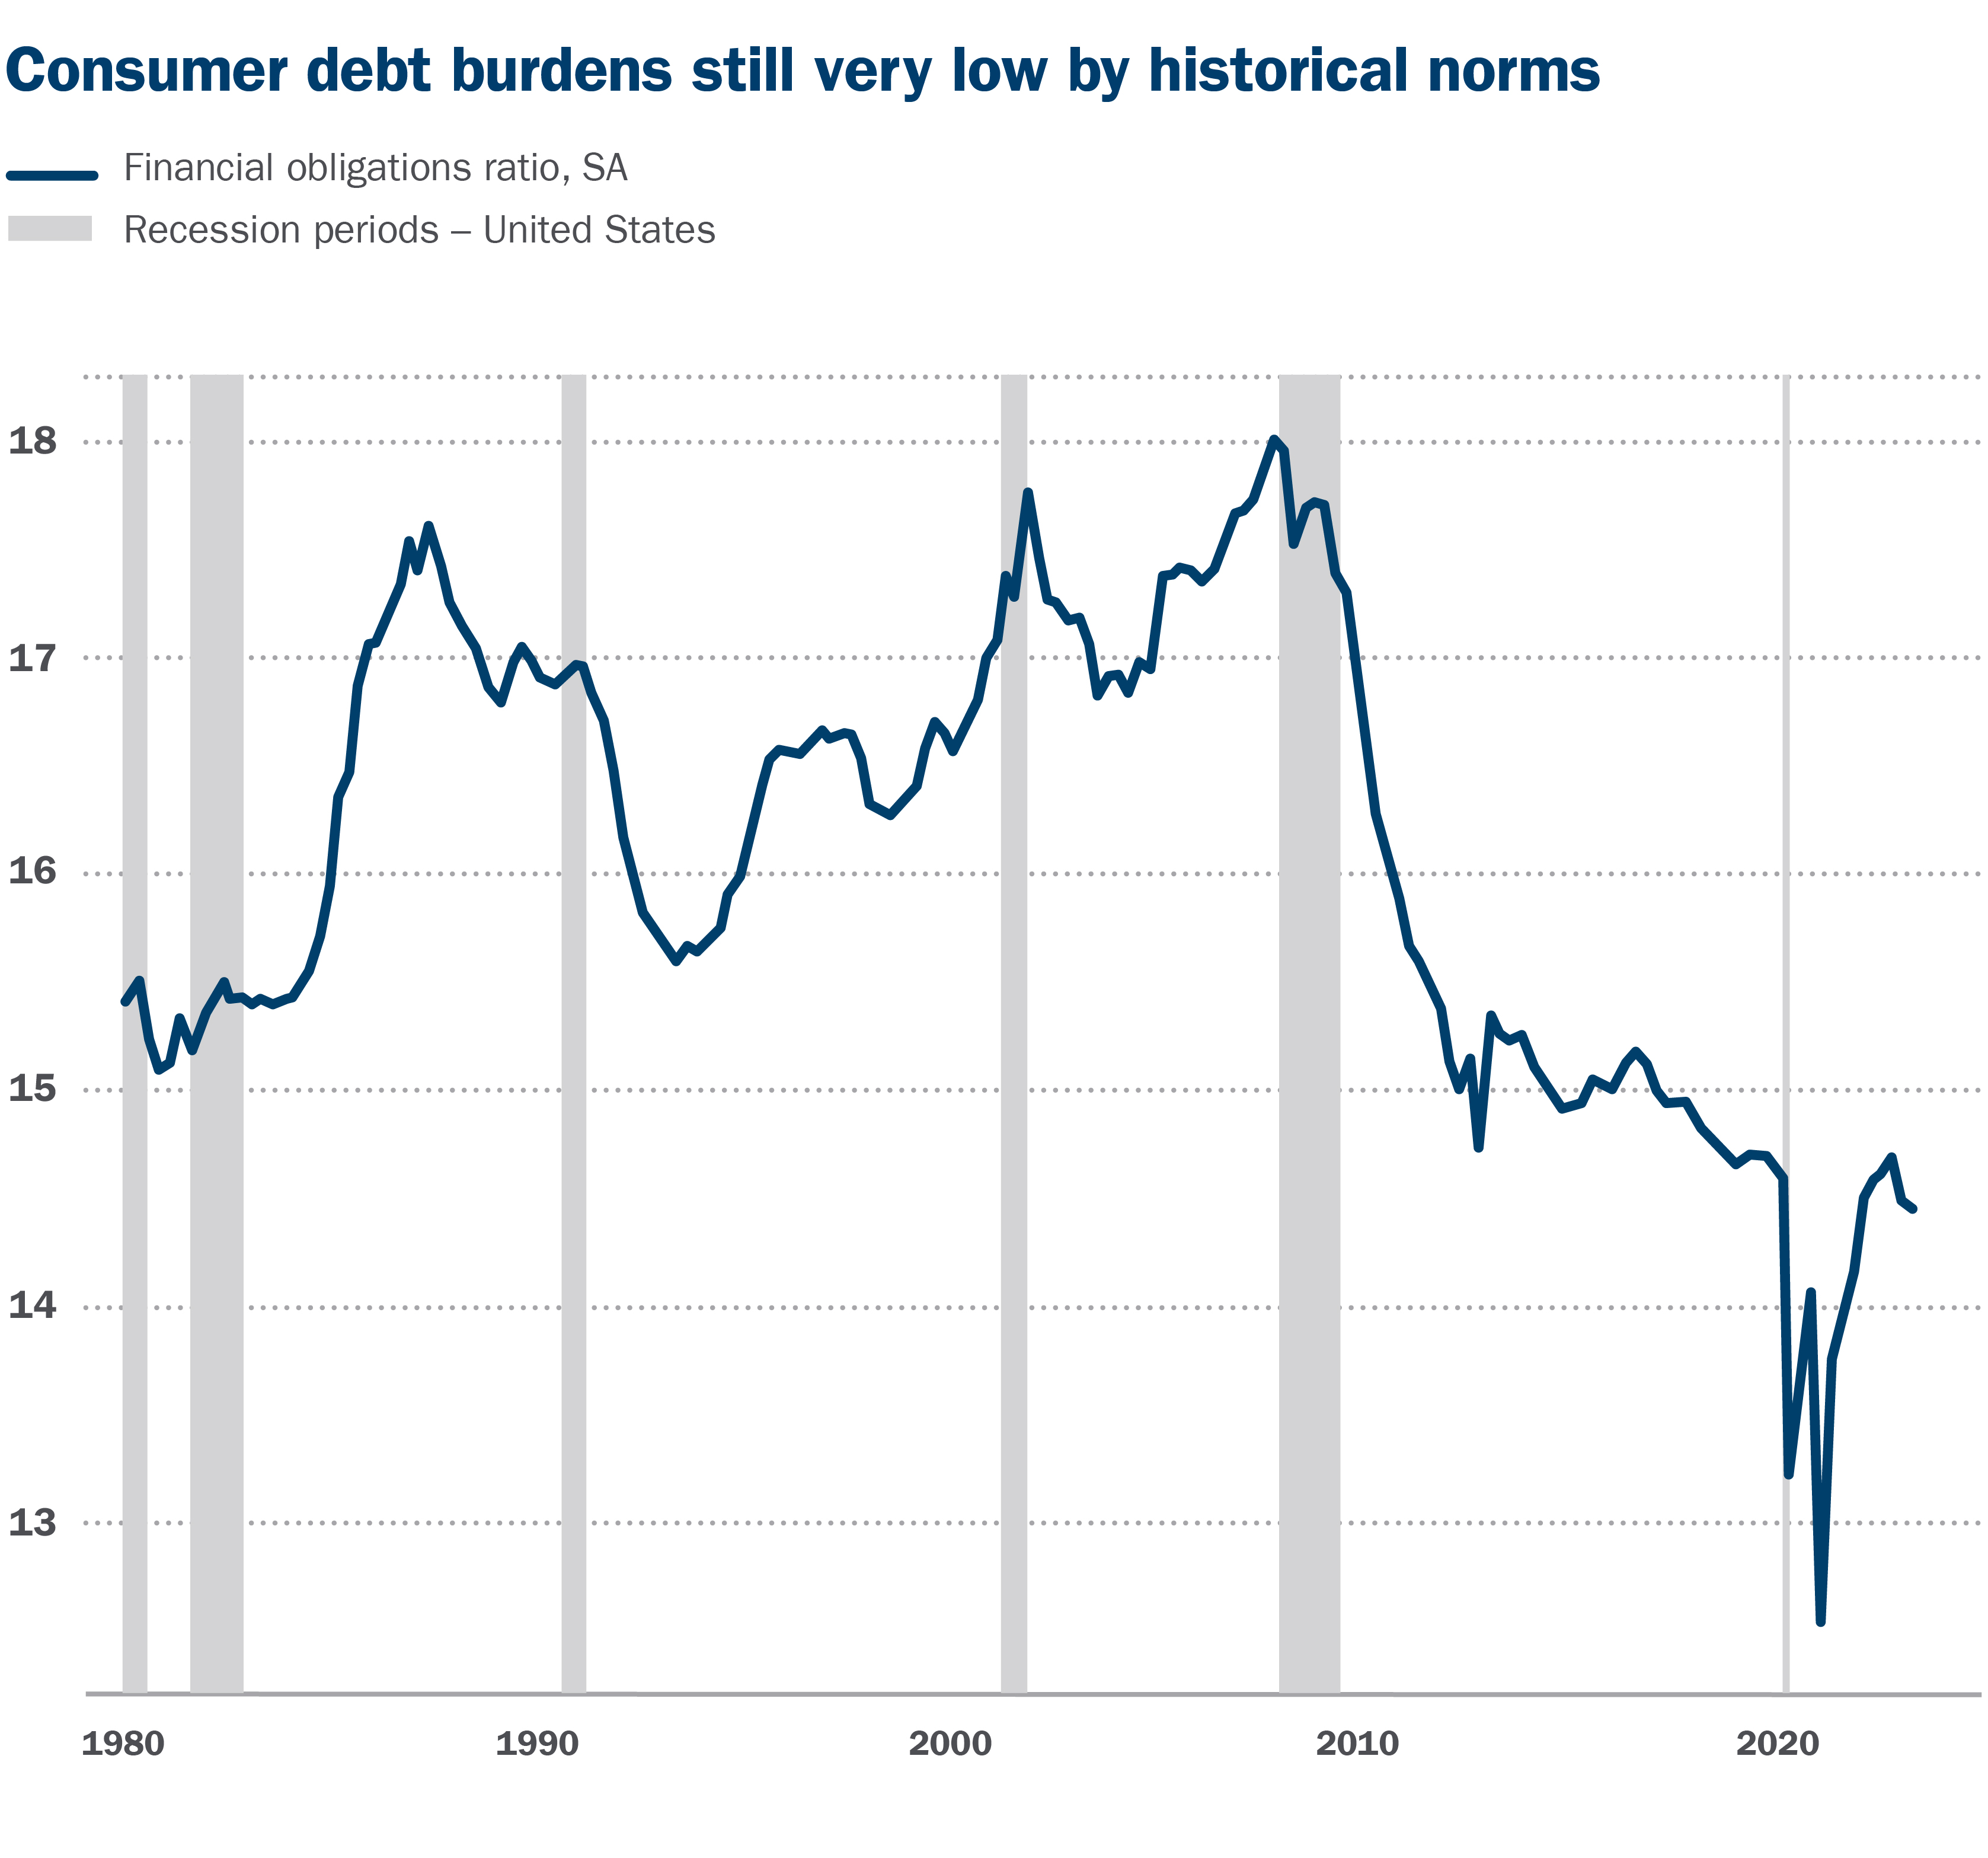
The financial obligations ratio measures household financial obligations as a percent of disposable personal income. It includes rent payments on tenant-occupied property, auto lease payments, homeowners' insurance, and property tax payments.
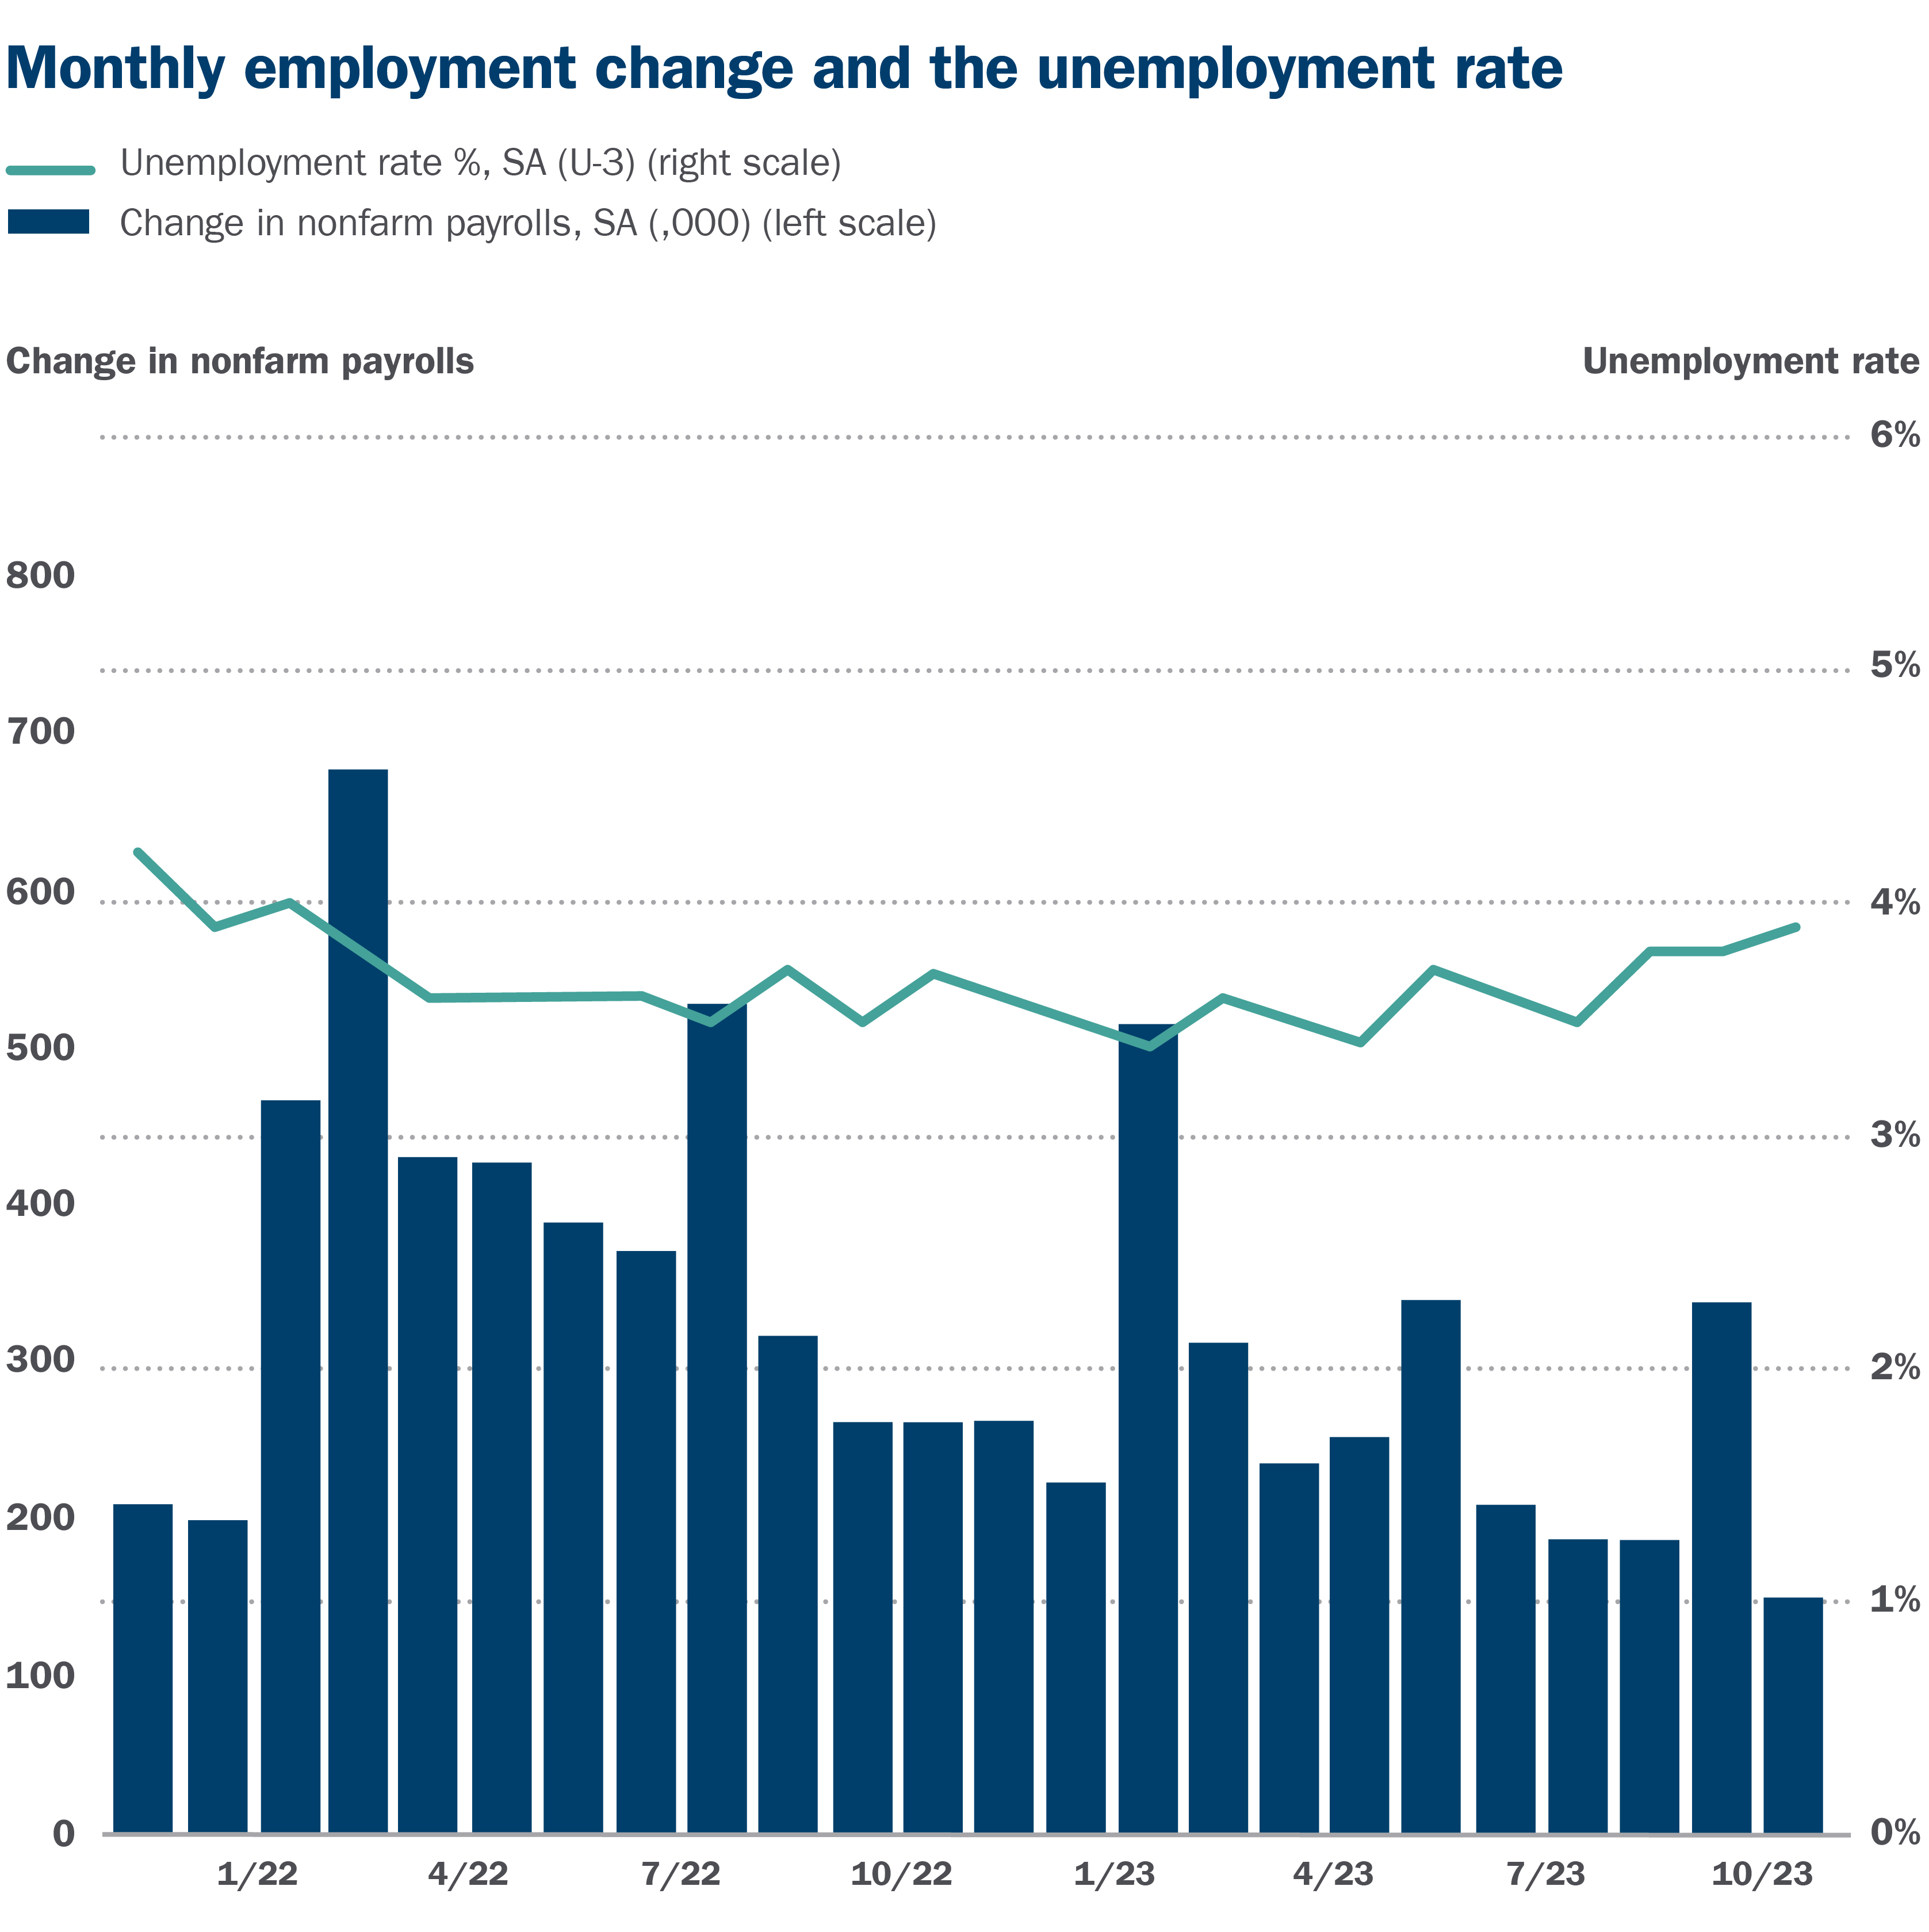
6. A solid — but softening — job market
Job creation was much stronger than expected in 2023 and the unemployment rate remained below 4%. We believe the pace of job growth could slow noticeably in 2024 along with the broader economy. If so, the unemployment rate may rise modestly from 2023’s muti-decade lows but we believe labor market fundamentals are likely to remain healthy and the unemployment rates should remain below a historically sound level of about 5%.
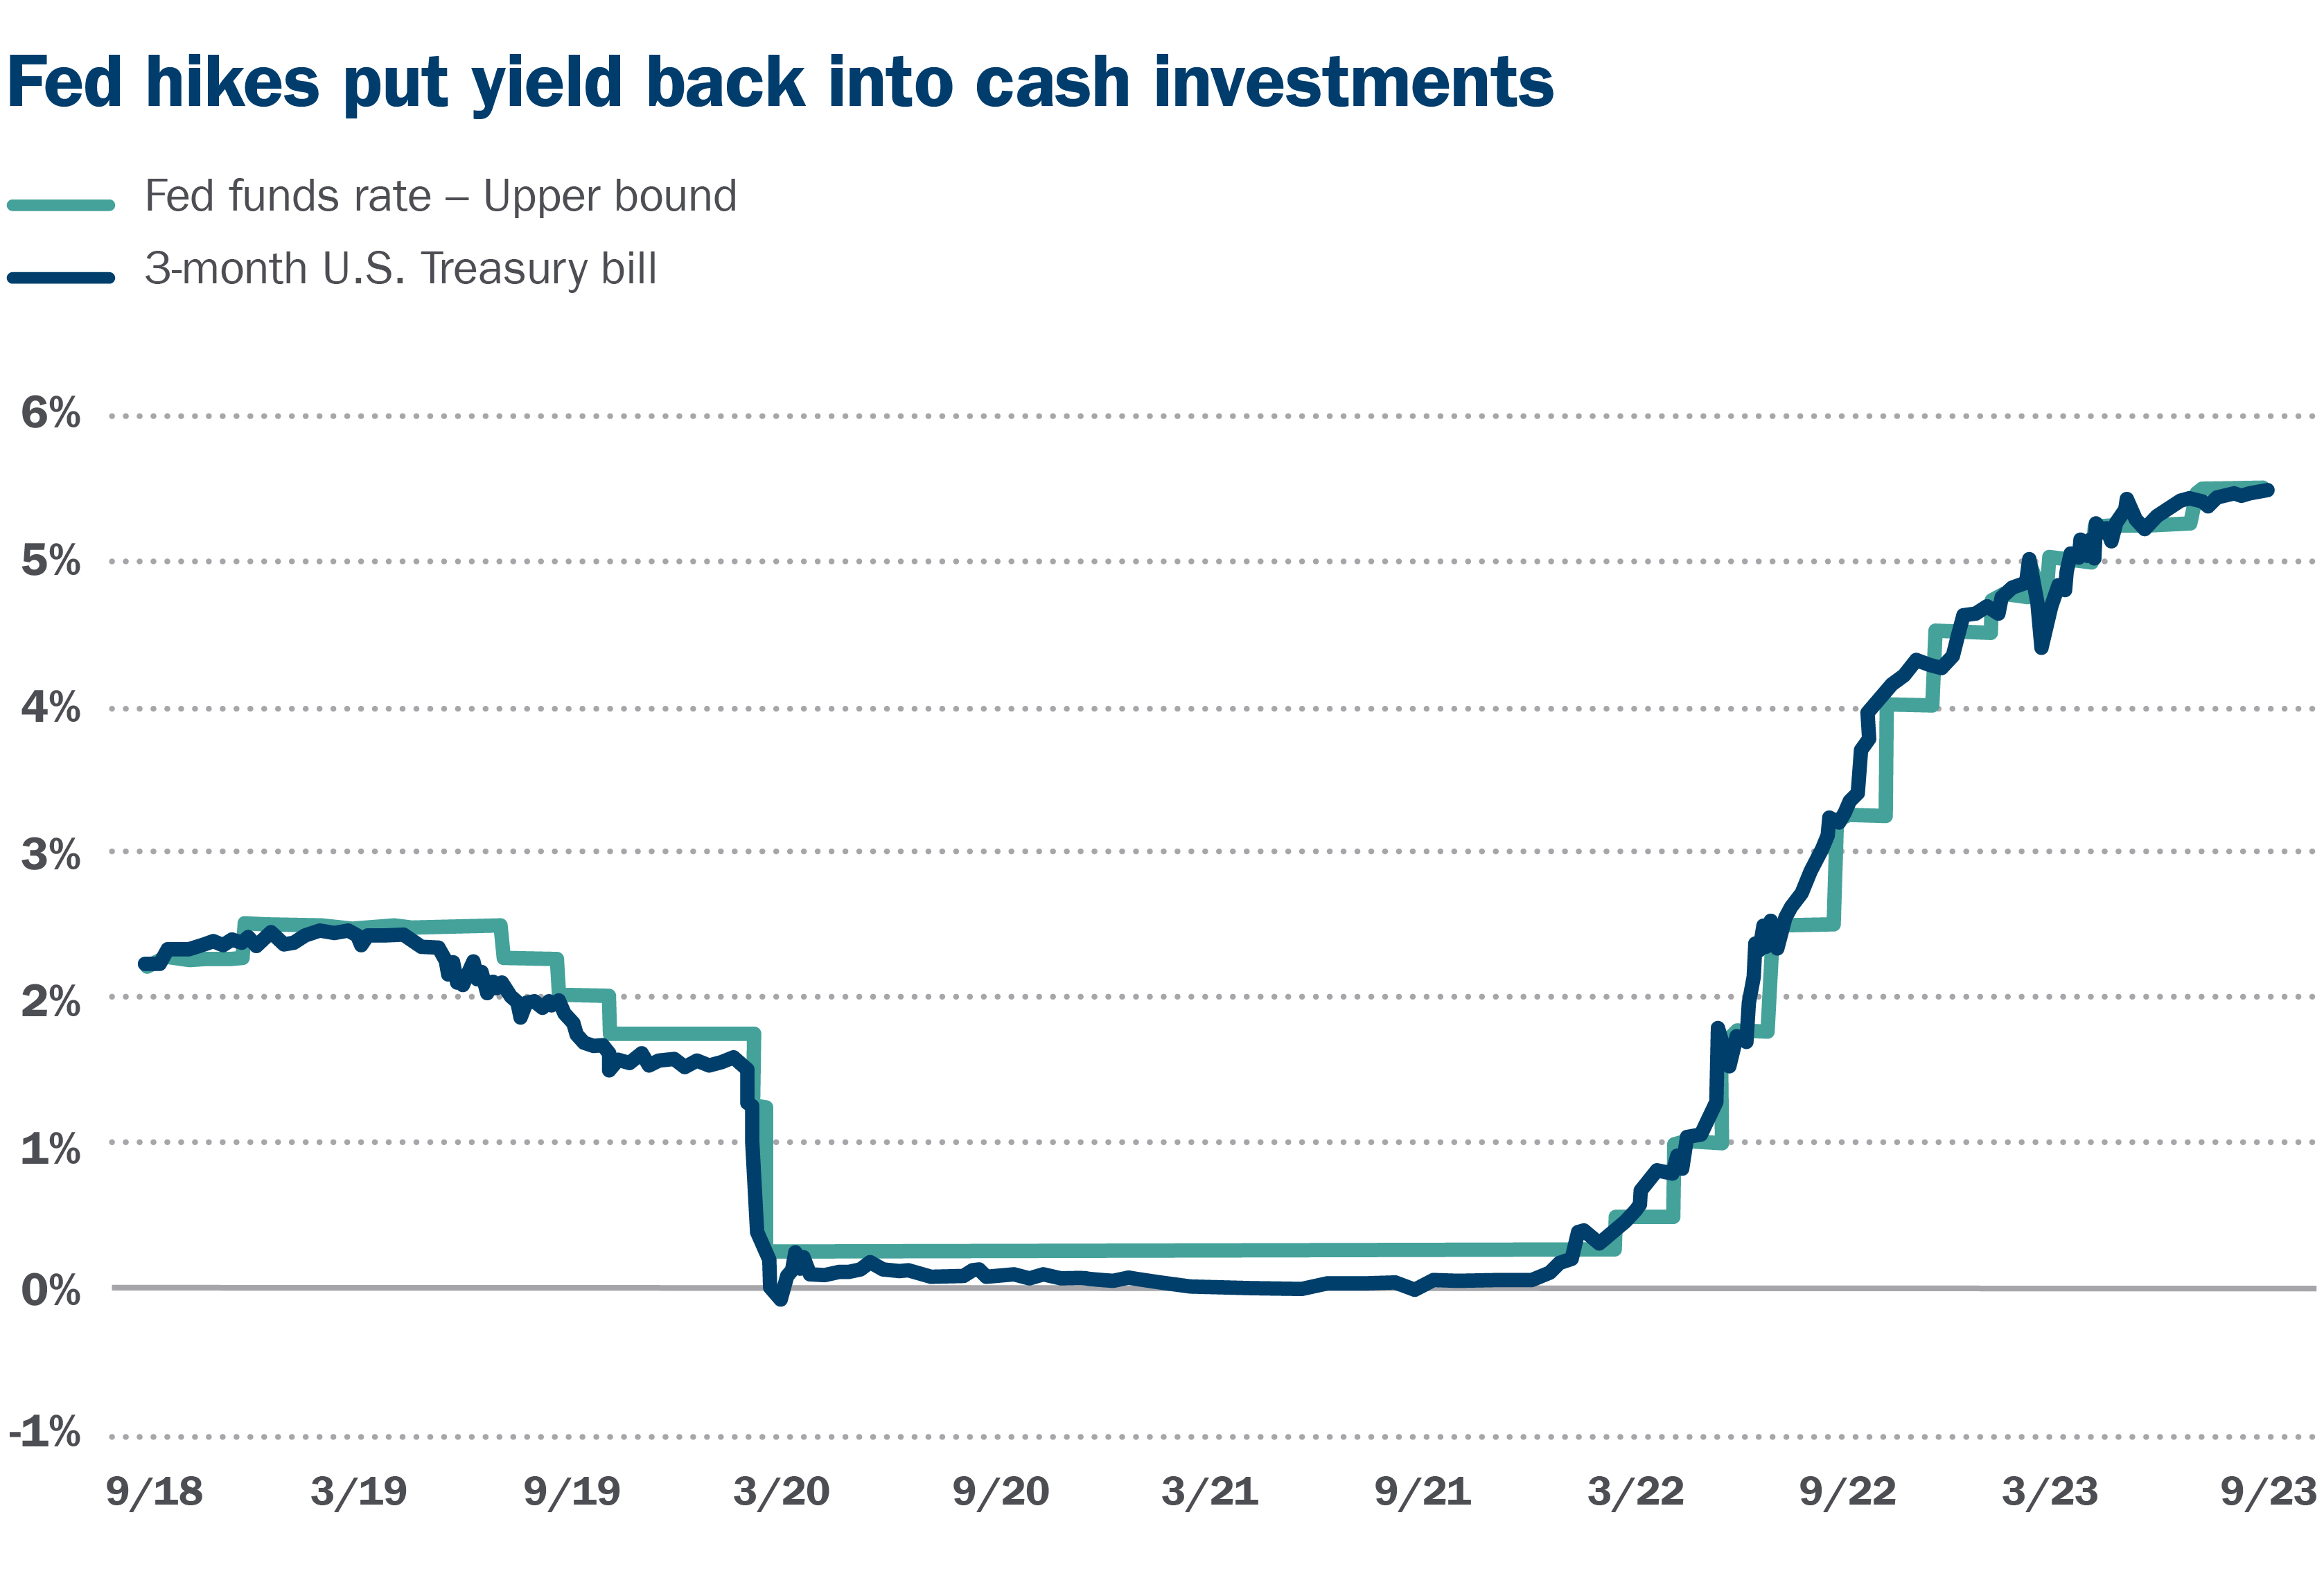
7. The comeback of cash investments
As Fed policy rates go, so do yields on cash investments. Aggressive Fed rate hikes from 2022 into 2023 lifted the yield available on cash investments. The potential for Fed policy to settle lower over time, combined with the run-up of Treasury yields further out the curve since mid-year suggest the window of opportunity is now open to roll excess funds held in cash out into fixed income in our view. As opposed to the short timeframe at which cash investments reset, longer-term fixed income may not only capture yield supporting income for longer, but it can also serve as a diversifier/stabilizer for total return portfolios now that elevated inflation concerns have moved to the margin.
These figures are shown for illustrative purposes only and are not guaranteed. They do not reflect investment/product fees or expenses, which would reduce the figures shown here. Past performance is not a guarantee of future results.
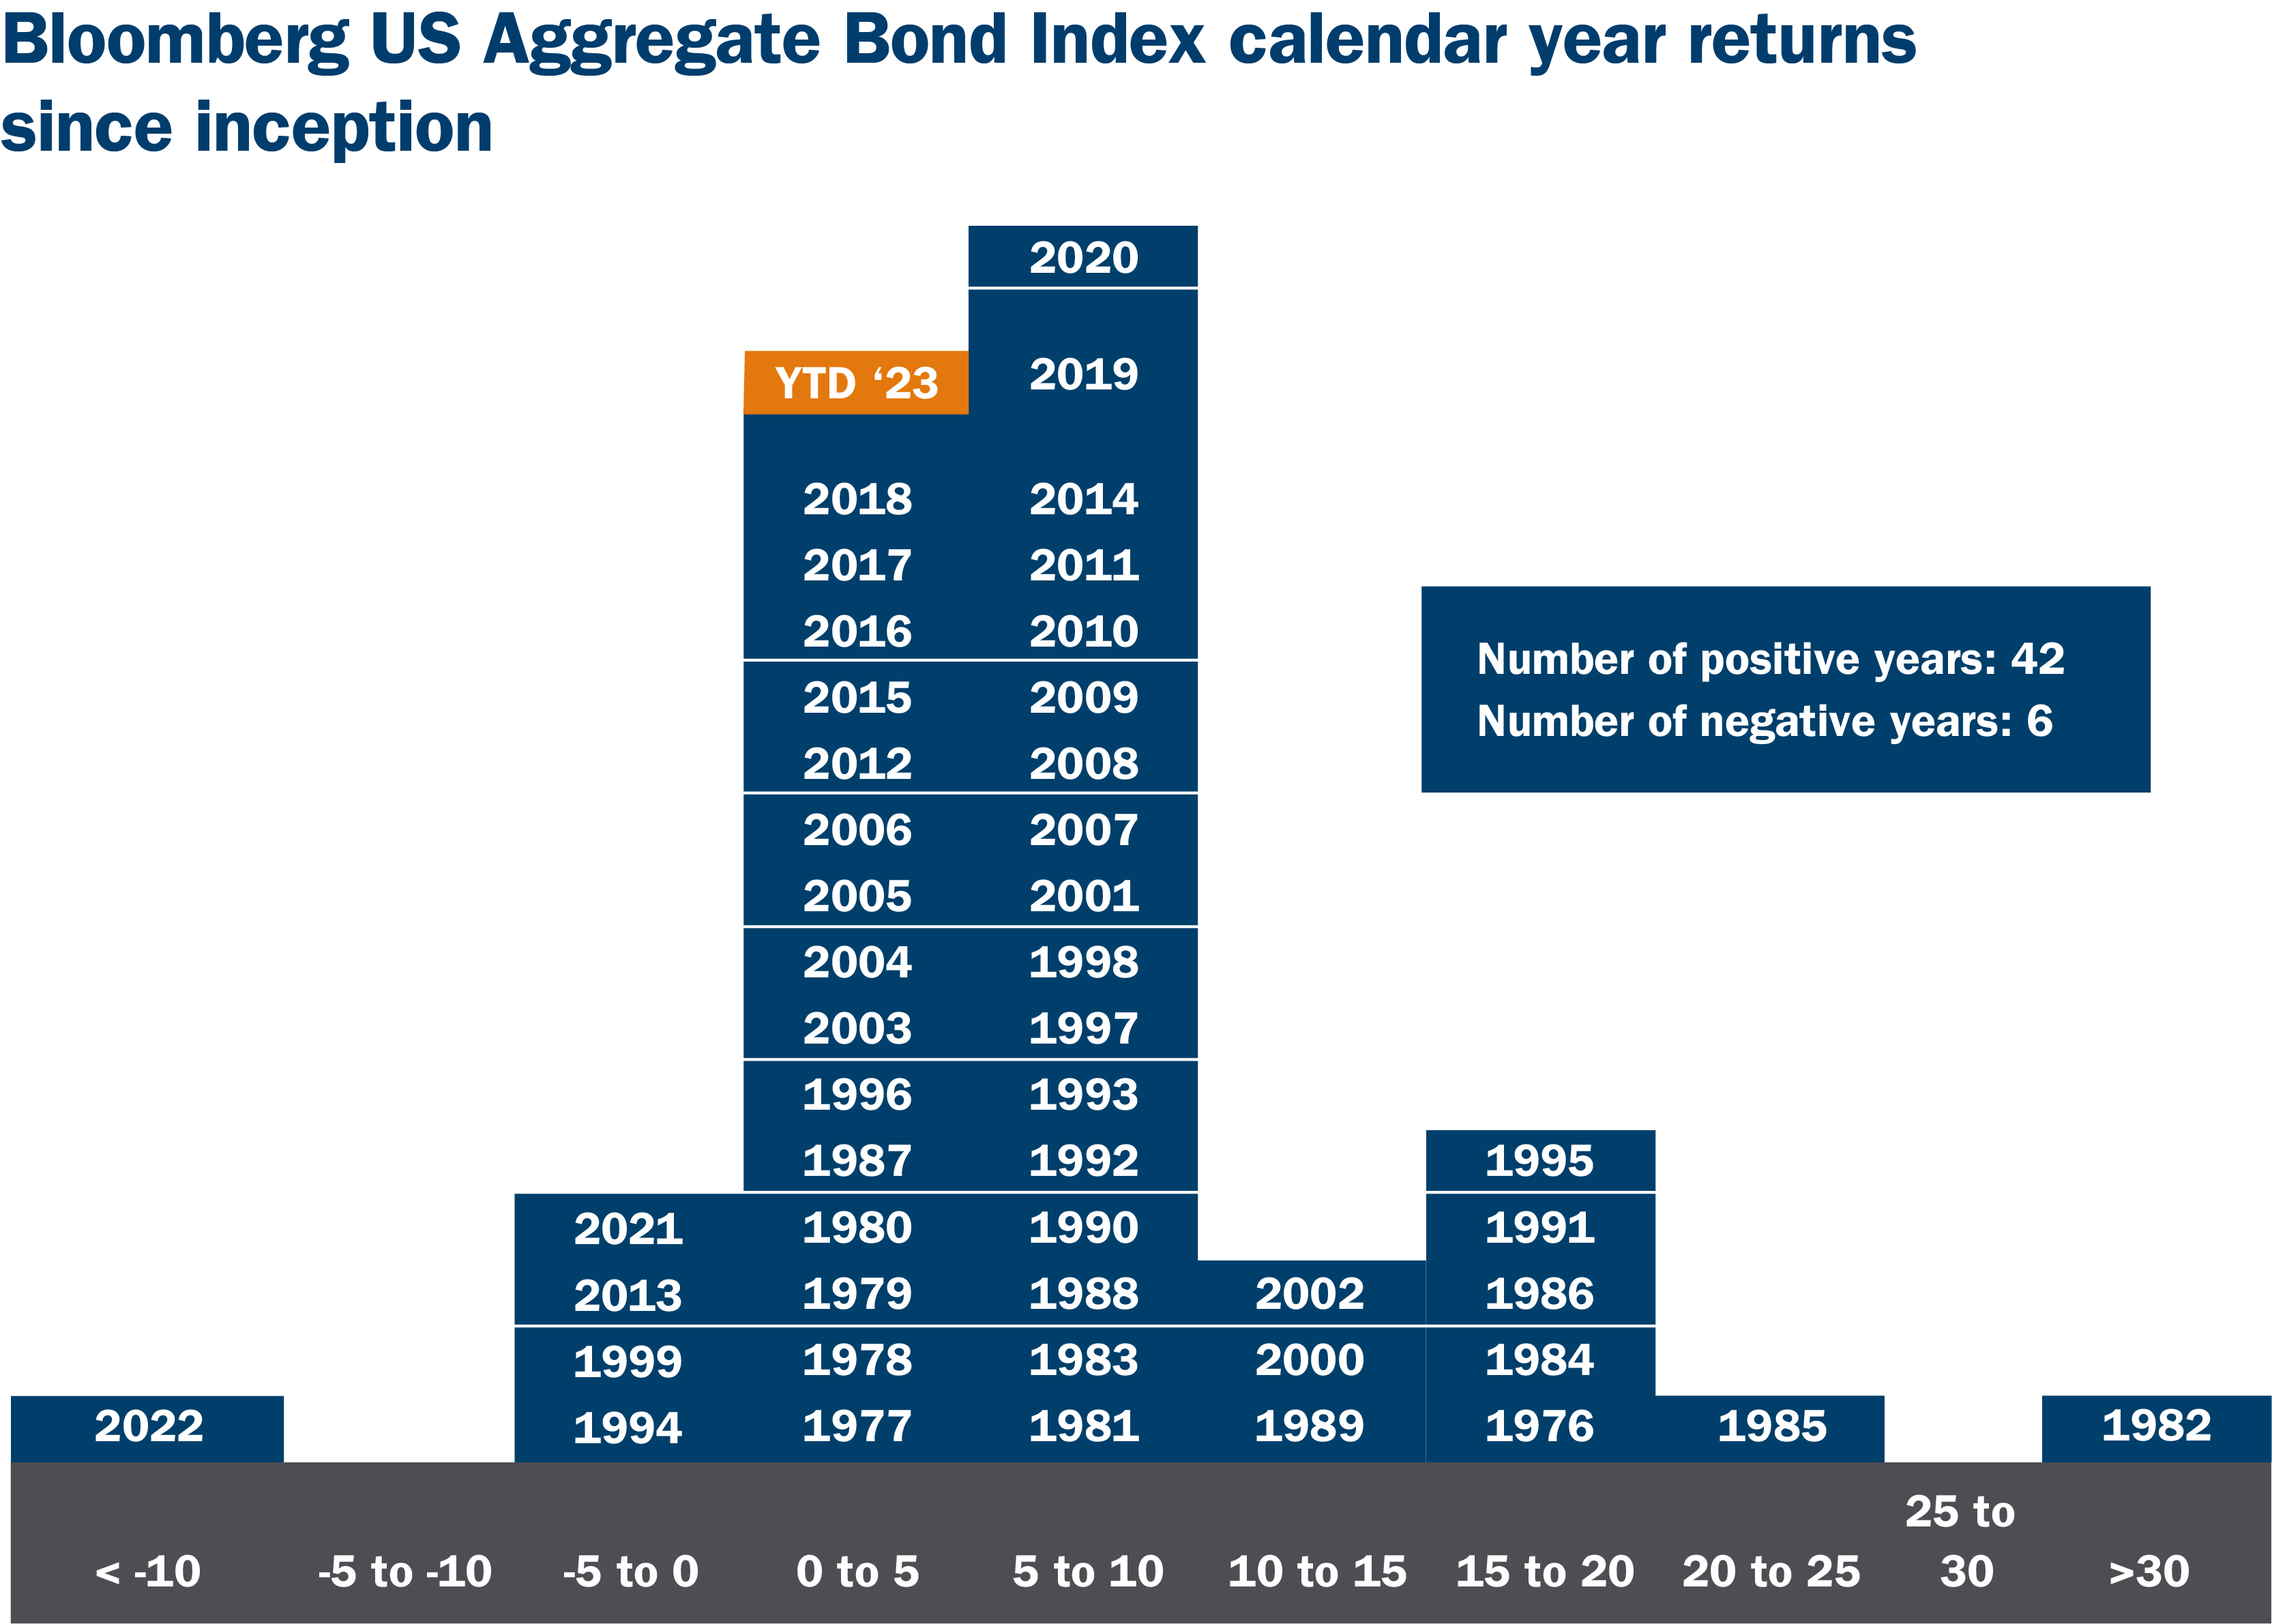
8. A lukewarm year for bonds
By the end of November, the Bloomberg US Aggregate Bond Index stood narrowly in the green for the year. Should the full year total return come in negative, recent years would reflect half of the years with negative total returns since the index’s inception in 1982, and the first string of three consecutive years. Since yields rise as prices fall on fixed income investments, recent challenging performance effectively reflated fixed income yields, leaving abundant opportunities similar to the early 2000s.
These figures are shown for illustrative purposes only and are not guaranteed. It is not possible to invest directly in an index. Past performance is not a guarantee of future results.
9. Finally, a competitive Treasury yield
Real, inflation-adjusted yields returned to U.S. Treasury markets in 2022, with the real 10-year Treasury yields bounding above the 2003-2007 average. While the TINA theme — there is no alternative (to stocks) — drove returns and yields in 2020 and 2021, we see current, elevated real yields as a sign to potentially move excess cash, and even risk-oriented dollars, to fixed income. Today, reasonable yields are widely available, starting with U.S. Treasuries and extending into credit segments of the market.
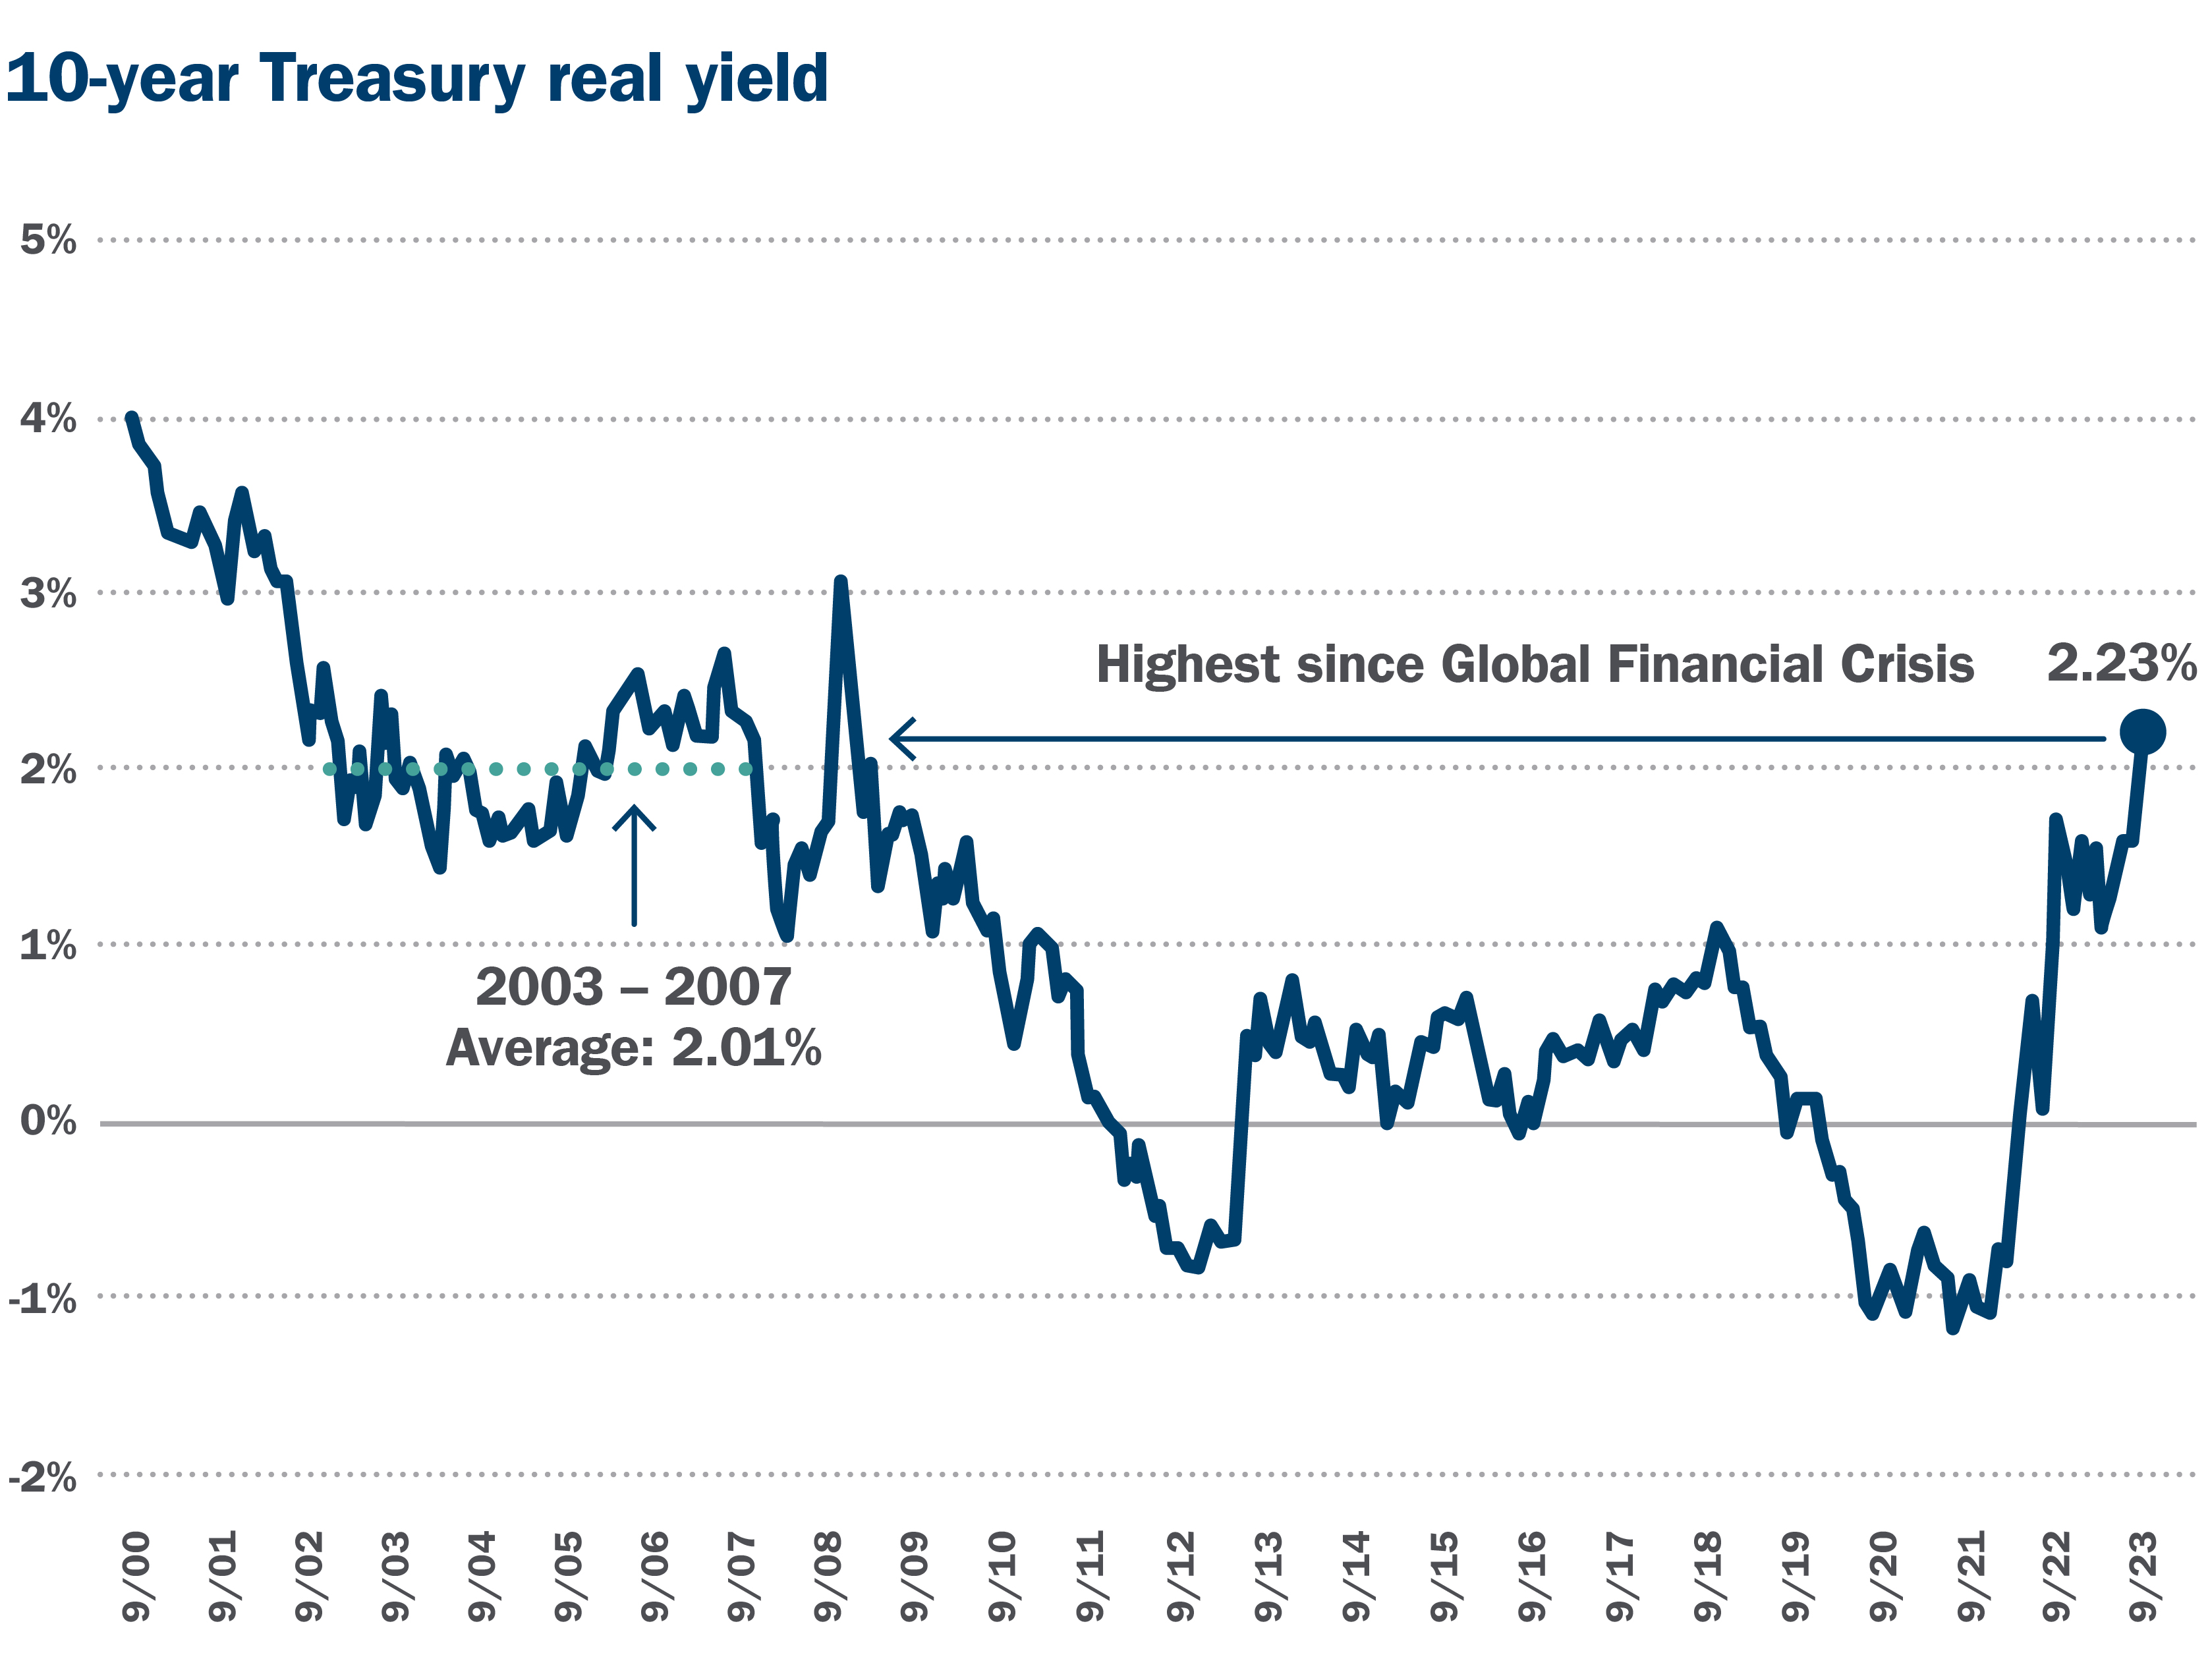
These figures are shown for illustrative purposes only and are not guaranteed. Past performance is not a guarantee of future results.
Start your 2024 planning now
With 2023 almost at a close, consider connecting with your Ameriprise financial advisor to discuss how to position your portfolio for the new year.
Sources: FactSet and Bloomberg unless otherwise noted. FactSet and Bloomberg are independent investment research companies that compile and provide financial data and analytics to firms and investment professionals such as Ameriprise Financial and its analysts. They are not affiliated with Ameriprise Financial, Inc.
The views expressed are as of the date given, may change as market or other conditions change, and may differ from views expressed by other Ameriprise Financial associates or affiliates. Actual investments or investment decisions made by Ameriprise Financial and its affiliates, whether for its own account or on behalf of clients, will not necessarily reflect the views expressed. This information is not intended to provide investment advice and does not account for individual investor circumstances.
Some of the opinions, conclusions and forward-looking statements are based on an analysis of information compiled from third-party sources. This information has been obtained from sources believed to be reliable, but accuracy and completeness cannot be guaranteed by Ameriprise Financial. It is given for informational purposes only and is not a solicitation to buy or sell the securities, accounts or strategies mentioned. The information is not intended to be used as the sole basis for investment decisions, nor should it be construed as advice designed to meet the specific needs of an individual investor. Please seek the advice of a financial advisor regarding your particular financial situation.
There are risks associated with fixed-income investments, including credit risk, interest rate risk, and prepayment and extension risk. In general, bond prices rise when interest rates fall and vice versa. This effect is usually more pronounced for longer term securities.
The fund’s investments may not keep pace with inflation, which may result in losses.
A rise in interest rates may result in a price decline of fixed-income instruments held by the fund, negatively impacting its performance and NAV. Falling rates may result in the fund investing in lower yielding debt instruments, lowering the fund’s income and yield. These risks may be heightened for longer maturity and duration securities.
Stock investments involve risk, including loss of principal. High-quality stocks may be appropriate for some investment strategies. Ensure that your investment objectives, time horizon and risk tolerance are aligned with investing in stocks, as they can lose value.
The products of technology companies may be subject to severe competition and rapid obsolescence, and their stocks may be subject to greater price fluctuations.
Past performance is not a guarantee of future results.
An index is a statistical composite that is not managed. It is not possible to invest directly in an index.
Definitions of individual indices and sectors mentioned in this article are available on our website at ameriprise.com/legal/disclosures in the Additional Ameriprise research disclosures section.
The Standard & Poor’s 500 Index (S&P 500® Index), an unmanaged index of common stocks, is frequently used as a general measure of market performance. The index reflects reinvestment of all distributions and changes in market prices but excludes brokerage commissions or other fees.
The NASDAQ composite index measures all NASDAQ domestic and international based common type stocks listed on the Nasdaq Stock Market.
The Dow Jones Industrial Average (DJIA) is an index containing stocks of 30 Large-Cap corporations in the United States. The index is owned and maintained by Dow Jones & Company.
The Russell 2000 Index measures the performance of the small-cap segment of the US equity universe. The Russell 2000 is constructed to provide a comprehensive and unbiased small-cap barometer and is completely reconstituted annually to ensure larger stocks do not distort the performance and characteristics of the true small-cap opportunity set. The Russell 2000 includes the smallest 2000 securities in the Russell 3000.
The Bloomberg US Aggregate Bond Index is a broad-based flagship benchmark that measures the investment grade, US dollar-denominated, fixed-rate taxable bond market. The index includes Treasuries, government-related and corporate securities, MBS (agency fixed-rate and hybrid ARM pass throughs), ABS and CMBS (agency and non-agency).
The Consumer Price Index (CPI) is a measure of the average change over time in the prices paid by urban consumers for a market basket of consumer goods and services. Indexes are available for the U.S. and various geographic areas.
A 10-year Treasury is a debt obligation issued by the United States government that matures in 10 years. The 10-year yield is typically used as a proxy for mortgage rates, and other measures.
Third party companies mentioned are not affiliated with Ameriprise Financial, Inc.
Diversification does not assure a profit or protect against loss.
Investment products are not insured by the FDIC, NCUA or any federal agency, are not deposits or obligations of, or guaranteed by any financial institution, and involve investment risks including possible loss of principal and fluctuation in value.
Securities offered by Ameriprise Financial Services, LLC. Member FINRA and SIPC.