Out with the old, in with the new
ANTHONY SAGLIMBENE – CHIEF MARKET STRATEGIST, AMERIPRISE FINANCIAL
WEEKLY MARKET PERSPECTIVES — January 5, 2026

Major U.S. stock averages finished the final week of 2025 lower, as Santa decided to skip over the historical late-year stock rally. However, stocks ended 2025 with another strong year of gains and enter 2026 with a mix of tailwinds and headwinds that will likely keep investors on their toes at the start of the year.
Last week in review:
-
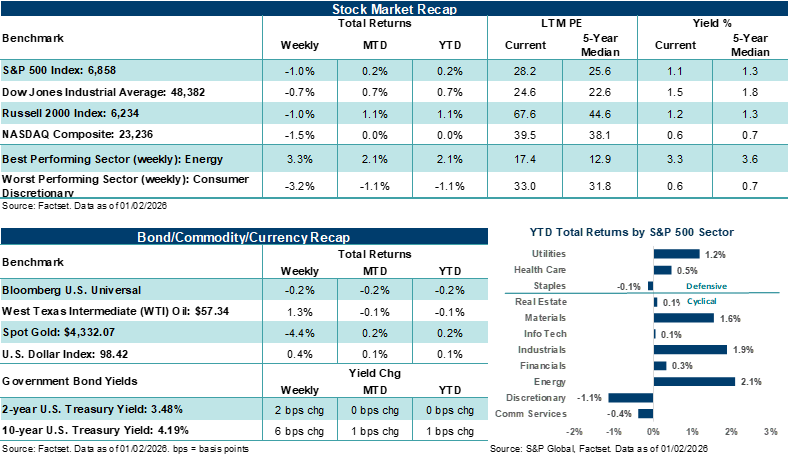
The S&P 500 Index (-1.0%) and NASDAQ Composite (-1.5%) each slipped lower during the shortened holiday week.
-
U.S. Treasury yields bumped higher, the U.S. Dollar Index rose, Gold moved lower, and West Texas Intermediate (WTI) crude settled higher.
- December FOMC minutes offered few surprises and reinforced the Federal Reserve’s commitment to gradual policy easing in 2026 amid varying views on the speed of rate cuts across the committee.
- Housing data surprised to the upside, weekly jobless claims declined, and investors looked ahead to early 2026 catalysts, which include benefits from larger tax returns, a Supreme Court decision on reciprocal tariffs, the upcoming earnings season, and the pending announcement of a new Fed Chair.
“As investors step into the new year, the path ahead for stocks likely depends on whether fundamental conditions continue to validate already elevated expectations for the year. In addition, AI investments translating into profits, efficiencies, productivity gains, as well as whether market strength can broaden beyond just a handful of Big Tech companies, will likely be other important factors to watch.”
Anthony Saglimbene - Chief Market Strategist, Ameriprise Financial
Out with the old, in with the new
Despite some roller-coaster events last year, the S&P 500 Index posted its third consecutive year of double-digit gains in 2025. While investors were busy celebrating the holidays and spending time with friends and family over the final weeks of the year, markets ended 2025 in a relatively quiet fashion. That said, December's performance across major stock averages should remind investors that momentum is continuing to cool, even if the overall market remained relatively calm heading into the new year. On a total return basis, the S&P 500 Index finished up +17.9% in 2025, while the NASDAQ Composite gained +21.1%. Notably, December performance across major stock averages was mixed, with the S&P 500 snapping a seven-month winning streak to finish slightly lower on the month. The NASDAQ also slipped lower in December after breaking its extended winning streak in November.
However, fourth quarter stock performance was generally constructive. U.S. equities rose for a third straight quarter, with the S&P 500 and NASDAQ advancing over +2.5% in Q4 on a total return basis. Several international benchmarks outperformed in Q4 and for the full year on a U.S. dollar basis, with the MSCI All Country World Index rising by +5.2% in the final three months of the year and finishing 2025 higher by nearly +32.0%.
In Q4, the 2-year U.S. Treasury yield fell 13 basis points to 3.48%, while the 10-year edged up just over two basis points to 4.17%. The U.S. Dollar Index gained +0.5% in Q4 after snapping a large two-quarter losing streak in Q3. Gold advanced +12.1% for the quarter, its fourth straight quarterly increase and after a +17.0% rally in Q3. Gold ended 2025 higher by an eye-popping +64.4% and was one of the best-performing assets of the year, amid heavy central bank purchases and hedging activity against geopolitical risks. West Texas Intermediate (WTI) crude fell 7.9% in Q4, its fourth consecutive quarterly decline. In our view, performance across fixed income and other assets outside stocks in the final months of 2025 was consistent with an environment of easing inflation, stable domestic growth, continued geopolitical risks, and an increase in “selective” risk-taking.
Notably, the U.S. economy showed surprising strength in December following a delay in key data due to the government shutdown. Real U.S. GDP for Q3 came in at a +4.3% annualized pace, with consumer spending up a better-than-expected +3.5%. Headline November CPI came in below consensus at +2.7% year-over-year, with core inflation at +2.6%, signaling renewed disinflationary traction, partly driven by housing. Yet, employment data was mixed as the year wound down, with November nonfarm payrolls rising modestly by 64,000 and the unemployment rate increasing to 4.6%. Weekly job data throughout December appeared to reflect a low-hiring, low-firing environment, with Fed Chair Powell noting that labor metrics may be overstating job growth. Speaking of the Chair, the Federal Reserve delivered a policy pivot in the final month of 2025, with a 25-basis-point rate cut, which lowered the fed funds target range to 3.50%-3.75%. Three officials dissented, with one favoring a larger cut and two preferring to hold rates steady. Powell emphasized that tariffs have added lingering pressure to goods prices, reiterated that labor data could be overstating gains, and kept the door open to flexibility without signaling imminent rate cuts. Most expect the Federal Reserve to hold rates steady this month. Importantly, we expect the market’s focus to begin turning to how monetary policy will be shaped under the “next” Fed Chair, starting in May, which President Trump could name as soon as this month.
Within stocks, artificial intelligence remained the defining market theme in the final months of 2025, albeit with more discerning eyes. According to FactSet, capital spending in Q3 totaled roughly $112 billion, up approximately +80.0% year-over-year across Microsoft, Alphabet, Meta Platforms, and Amazon. Nevertheless, scrutiny of AI spending increased in the fourth quarter. For example, Oracle’s five-year credit default swaps widened sharply, several infrastructure projects drew increased scrutiny due to execution and debt risks, and investors began to differentiate more forcefully between companies with visible cash flow prospects and those with less visible profit trends. Entering 2026, concentration risk remains a key concern, in our view. Broadcom plus the Magnificent Seven now account for roughly 40% of the S&P 500’s market capitalization, more than double the roughly 15% share commanded by the top eight names a decade ago. Thus, where Big Tech goes from here, so too may go the broader market.
From a historical perspective, 2025’s stock strength pushed the S&P 500 toward one of its best rolling three-year runs on record and sets up a rare possibility for a fourth year of stock gains in 2026, if our base case assumptions for this year come to pass. For example, if the Index delivers a fourth consecutive year of double-digit returns (as forecast in our favorable scenario), it would be a feat not accomplished since the late 1990s dot-com era. However, earnings growth will likely need to do most of the heavy lifting this year if valuations are to remain elevated. FactSet S&P 500 profit expectations indicate another year of double-digit earnings growth in 2026, driven by strong Tech earnings, productivity improvements across industries, ongoing AI adoption outside of Tech, and continued healthy capital market activity. In our view, companies’ ability to maintain healthy margins in 2026, combined with a broader range of companies participating in profit growth over the coming quarter, could be key factors that keep broader averages pointing higher over the next few quarters.
However, AI scrutiny is becoming a more “persistent” overhang for major U.S. stock indexes, especially where spending commitments appear misaligned with near-term revenue growth, and where leverage and refinancing risks are rising. Softer labor trends could also persist into the new year. Increased corporate commentary that leans toward less hiring or hiring freezes may continue to erode consumer confidence and lead to reduced spending (which held up remarkably well last year). For example, ISM employment components are already in contraction, and layoffs are rising on the edges. Under the radar, global central banks, outside of the Fed, shifted modestly hawkish in Q4, with Japan’s rate hike and higher Japanese Government Bond (JGB) yields reminding investors that policy normalization remains uneven globally. And here in the U.S., housing affordability pressures could cap consumer momentum even as headline inflation cools, while tariffs may remain a wildcard issue through the first half of the year.
Looking ahead, we believe the setup for markets suggests choppier conditions as investors digest the recent news flow over the holidays and prepare for the start of the fourth-quarter earnings season, which will begin mid-month. That said, we believe the underlying macroeconomic conditions in the U.S. are on a firm footing, which should ultimately help support stocks in 2026. Namely, cooling inflation trends, stable economic growth, opportunities for continued corporate profit growth, larger tax refunds for some U.S. workers, and a cautious but not restrictive Fed help support our generally constructive outlook.
Bottom line: As investors step into the new year, the path ahead for stocks likely depends on whether fundamental conditions continue to validate already elevated expectations for the year. In addition, AI investments translating into profits, efficiencies, productivity gains, as well as whether market strength can broaden beyond just a handful of Big Tech companies, will likely be other important factors to watch. For the S&P 500 to post a fourth year of double-digit returns in 2026, or post just positive performance for a fourth consecutive year, much of the favorable outlook for this year that’s already reflected in prices will need to come to pass. As we noted in our 2026 Outlook and Themes report published in mid-December, investors would be wise to prepare for a range of market scenarios this year, temper return expectations and ensure their portfolios can participate when stock conditions are enjoying tailwinds but also weather the occasional headwinds that are bound to develop over the course of the year.
The week ahead:
-
In the first full week of 2026, investors will focus their attention on U.S. employment trends. The December ADP Employment Survey (Wednesday), November JOLTS (Thursday), and December nonfarm payrolls (Friday) are on tap.
-
December ISM Manufacturing and Services reads throughout the week will also be closely watched.